Maximize Monitoring in Rancher 2.5 with Prometheus
We dedicate a lot of space in our blog to the topic of monitoring. That’s because when you’re managing Kubernetes clusters, things can change quickly. It’s important that you have tools to monitor the health and resource metrics of your clusters.
In Rancher 2.5, we introduced a new version of our monitoring based on the Prometheus Operator, which provides Kubernetes-native deployment and management of Prometheus and related monitoring components. Prometheus operator lets you monitor the state and processes of your cluster nodes, Kubernetes components and application workloads. It also defines alerts based on metrics collected via Prometheus and creates custom dashboards to make it easy to visualize collected metrics via Grafana. Get more details on the new monitoring components here.
The new monitoring also rolls out the prometheus-adapter, which developers can leverage to scale their workloads based on custom metrics and Horizontal Pod Autoscalar (HPA).
In this blog, we will explore how to leverage Prometheus Operator for scraping custom metrics and leveraging the same for advanced workload management.
Install Prometheus
Installing Prometheus from Rancher 2.5 is straightforward. Just visit Cluster Explorer -> Apps and install rancher-monitoring.

You need to be aware of these defaults:
prometheus-adapteris enabled as part of the chart installation.ServiceMonitorNamespaceSelectoris left empty, allowing Prometheus to scrape ServiceMonitors in all namespaces.
Once installation is complete, we can access the monitoring components from Cluster Explorer.
Deploy Workload
Now let’s deploy a sample workload that exposes custom metrics from the application layer. The workload exposes a simple application that has been instrumented using the Prometheus client_golang libraries and serves up some custom metrics at /metric endpoint.
It serves two metrics:
- http_requests_total
- http_request_duration_seconds
The following manifest deploys the workload, the associated service and ingress to access this workload.
apiVersion: apps/v1
kind: Deployment
metadata:
  labels:
    app.kubernetes.io/name: prometheus-example-app
  name: prometheus-example-app
spec:
  replicas: 1
  selector:
    matchLabels:
      app.kubernetes.io/name: prometheus-example-app
  template:
    metadata:
      labels:
        app.kubernetes.io/name: prometheus-example-app
    spec:
      containers:
      - name: prometheus-example-app
        image: gmehta3/demo-app:metrics
        ports:
        - name: web
          containerPort: 8080
---
apiVersion: v1
kind: Service
metadata:
  name: prometheus-example-app
  labels:
    app.kubernetes.io/name: prometheus-example-app
spec:
  selector:
    app.kubernetes.io/name: prometheus-example-app
  ports:
    - protocol: TCP
      port: 8080
      targetPort: 8080
      name: web
---
apiVersion: networking.k8s.io/v1beta1
kind: Ingress
metadata:
    name: prometheus-example-app
spec:
    rules:
    - host: hpa.demo
      http:
        paths:
        - path: /
          backend:
            serviceName: prometheus-example-app
            servicePort: 8080
Deploy ServiceMonitor
The ServiceMonitor is a custom resource definition (CRD) that allows us to declaratively define how a dynamic set of services should be monitored.
You can check out the full spec for ServiceMonitor here.
Now let’s deploy ServiceMonitor, which Prometheus uses to scrape the pods that make up the prometheus-example-app Kubernetes service.
apiVersion: monitoring.coreos.com/v1
kind: ServiceMonitor
metadata:
  name: prometheus-example-app
spec:
  selector:
    matchLabels:
      app.kubernetes.io/name: prometheus-example-app
  endpoints:
  - port: web
As you can see, now users can browse the ServiceMonitor in Rancher Monitoring.
In a short while, the new service monitor and pods associated with the service should be reflected in the Prometheus service discovery.
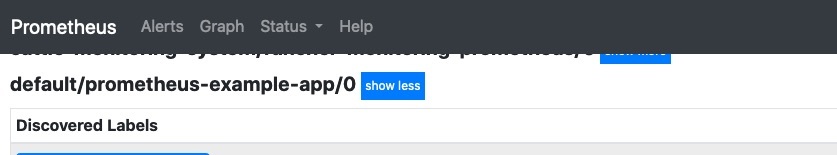
We can also view the metrics in Prometheus.
Deploy Grafana Dashboard
Monitoring in Rancher 2.5 allows users to store Grafana dashboards as ConfigMaps in the cattle-dashboards namespace.
Users/Cluster admins can now add more dashboards in this namespace to extend Grafana to have custom dashboards.
Dashboard ConfigMap Example
Dashboard ConfigMap ExampleapiVersion: v1
kind: ConfigMap
metadata:
name: prometheus-example-app-dashboard
namespace: cattle-dashboards
labels:
grafana_dashboard: "1"
data:
prometheus-example-app.json: |
{
"annotations": {
"list": [
{
"builtIn": 1,
"datasource": "-- Grafana --",
"enable": true,
"hide": true,
"iconColor": "rgba(0, 211, 255, 1)",
"name": "Annotations & Alerts",
"type": "dashboard"
}
]
},
"editable": true,
"gnetId": null,
"graphTooltip": 0,
"links": [],
"panels": [
{
"aliasColors": {},
"bars": false,
"dashLength": 10,
"dashes": false,
"datasource": null,
"fieldConfig": {
"defaults": {
"custom": {}
},
"overrides": []
},
"fill": 1,
"fillGradient": 0,
"gridPos": {
"h": 9,
"w": 12,
"x": 0,
"y": 0
},
"hiddenSeries": false,
"id": 2,
"legend": {
"avg": false,
"current": false,
"max": false,
"min": false,
"show": true,
"total": false,
"values": false
},
"lines": true,
"linewidth": 1,
"nullPointMode": "null",
"percentage": false,
"pluginVersion": "7.1.5",
"pointradius": 2,
"points": false,
"renderer": "flot",
"seriesOverrides": [],
"spaceLength": 10,
"stack": false,
"steppedLine": false,
"targets": [
{
"expr": "rate(http_requests_total{code="200",service="prometheus-example-app"}[5m])",
"instant": false,
"interval": "",
"legendFormat": "",
"refId": "A"
}
],
"thresholds": [],
"timeFrom": null,
"timeRegions": [],
"timeShift": null,
"title": "http_requests_total_200",
"tooltip": {
"shared": true,
"sort": 0,
"value_type": "individual"
},
"type": "graph",
"xaxis": {
"buckets": null,
"mode": "time",
"name": null,
"show": true,
"values": []
},
"yaxes": [
{
"format": "short",
"label": null,
"logBase": 1,
"max": null,
"min": null,
"show": true
},
{
"format": "short",
"label": null,
"logBase": 1,
"max": null,
"min": null,
"show": true
}
],
"yaxis": {
"align": false,
"alignLevel": null
}
},
{
"aliasColors": {},
"bars": false,
"dashLength": 10,
"dashes": false,
"datasource": null,
"description": "",
"fieldConfig": {
"defaults": {
"custom": {}
},
"overrides": []
},
"fill": 1,
"fillGradient": 0,
"gridPos": {
"h": 8,
"w": 12,
"x": 0,
"y": 9
},
"hiddenSeries": false,
"id": 4,
"legend": {
"avg": false,
"current": false,
"max": false,
"min": false,
"show": true,
"total": false,
"values": false
},
"lines": true,
"linewidth": 1,
"nullPointMode": "null",
"percentage": false,
"pluginVersion": "7.1.5",
"pointradius": 2,
"points": false,
"renderer": "flot",
"seriesOverrides": [],
"spaceLength": 10,
"stack": false,
"steppedLine": false,
"targets": [
{
"expr": "rate(http_requests_total{code!="200",service="prometheus-example-app"}[5m])",
"interval": "",
"legendFormat": "",
"refId": "A"
}
],
"thresholds": [],
"timeFrom": null,
"timeRegions": [],
"timeShift": null,
"title": "http_requests_total_not_200",
"tooltip": {
"shared": true,
"sort": 0,
"value_type": "individual"
},
"type": "graph",
"xaxis": {
"buckets": null,
"mode": "time",
"name": null,
"show": true,
"values": []
},
"yaxes": [
{
"format": "short",
"label": null,
"logBase": 1,
"max": null,
"min": null,
"show": true
},
{
"format": "short",
"label": null,
"logBase": 1,
"max": null,
"min": null,
"show": true
}
],
"yaxis": {
"align": false,
"alignLevel": null
}
}
],
"schemaVersion": 26,
"style": "dark",
"tags": [],
"templating": {
"list": []
},
"time": {
"from": "now-15m",
"to": "now"
},
"timepicker": {
"refresh_intervals": [
"5s",
"10s",
"30s",
"1m",
"5m",
"15m",
"30m",
"1h",
"2h",
"1d"
]
},
"timezone": "",
"title": "prometheus example app",
"version": 1
}Users should now be able to access the “prometheus example app” dashboard in Grafana.

HPA with Custom Metrics
This section assumes the prometheus-adapter was installed as part of the monitoring installation.
Monitoring by default installs the prometheus-adapter.
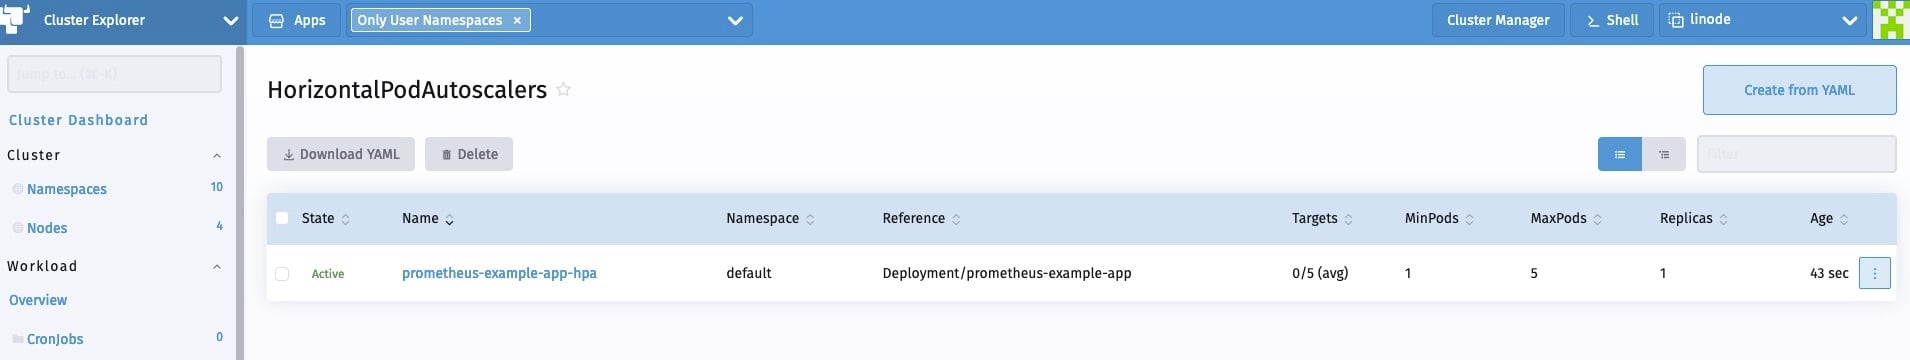
Users can now create a HPA spec as follows:
apiVersion: autoscaling/v2beta2
kind: HorizontalPodAutoscaler
metadata:
  name: prometheus-example-app-hpa
spec:
  scaleTargetRef:
    apiVersion: apps/v1
    kind: Deployment
    name: prometheus-example-app
  minReplicas: 1
  maxReplicas: 5
  metrics:
  - type: Object
    object:
        describedObject:
            kind: Service
            name: prometheus-example-app
        metric:
            name: http_requests
        target:
            averageValue: "5"
            type: AverageValue
More details about HPA are available here
We’ll use the custom http_requests_total metric to perform pod autoscaling.
Now we can generate a sample load to see HPA in action. I can use hey for the same.
hey -c 10 -n 5000 http://hpa.demo
Summary
In this blog, we can explored the flexibility of the new monitoring in Rancher 2.5. Developers and cluster administrators can leverage the stack to monitor their workloads, deploy visualization and leverage the advanced workload management capabilities available within Kubernetes.
Related Articles
Nov 07th, 2022
Securing the Usage of volumeMounts with Kubewarden
Aug 07th, 2023
Understanding and Optimizing CI/CD Pipelines
Jul 22nd, 2022
Managing Your Hyperconverged Network with Harvester
Apr 20th, 2023