Rancher 2.3: Istio and Kiali
Rancher is a single point of control to manage all your kubernetes clusters
anywhere. Rancher 2.3.x was released a few weeks back and it came with huge
updates.
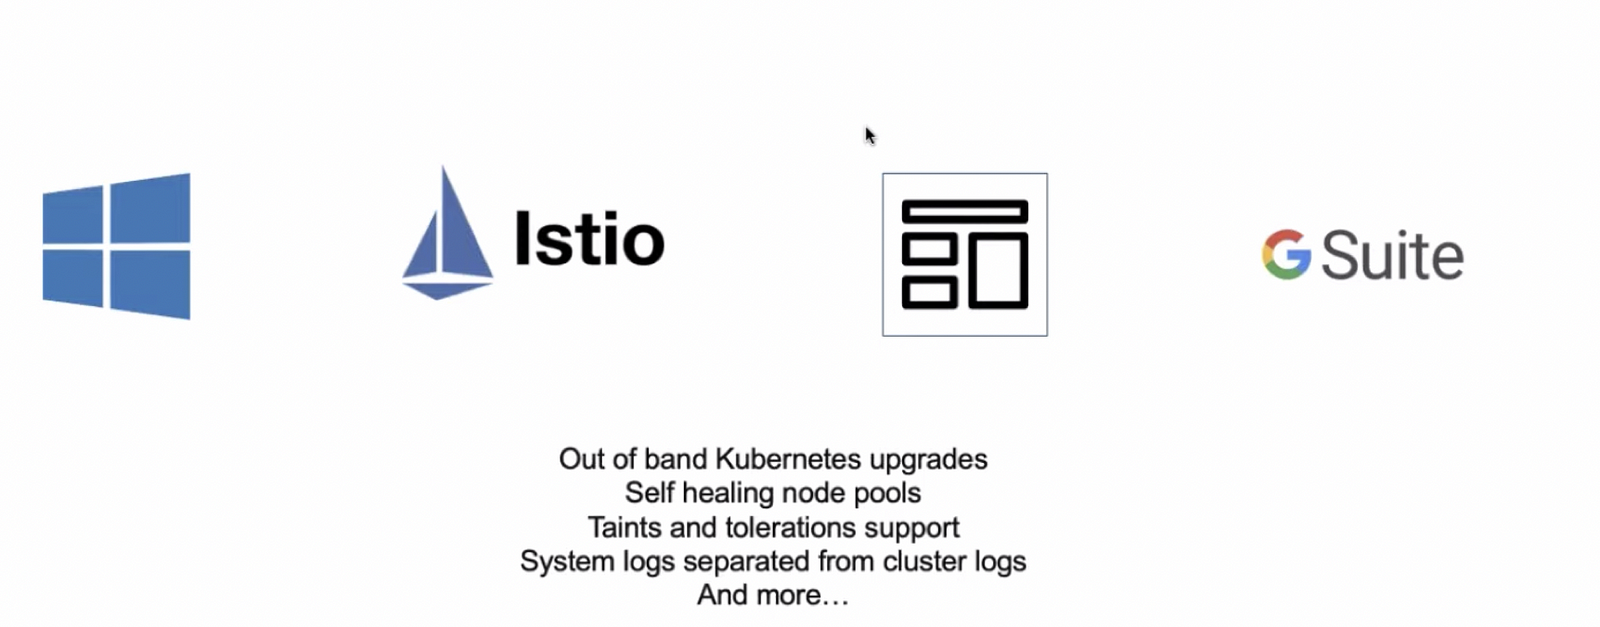
Top Features included Istio and Windows nodes support. In this article,
we will mainly discuss Istio support offered out of the box through the Rancher UI, see
an example deployment, and visualize it via the Kiali dashboard.
Prerequisites:
- Kubernetes Cluster up and running
- Rancher Installation and importing the cluster
In this example, we will use a Large k3s managed cluster by Civo Cloud with Rancher
App Installed (Rancher Application from the marketplace will install Rancher on
the cluster and import it as well). You can find the steps for setting up the
cluster in this
post.
While launching the cluster, select Rancher Application from the marketplace to
install Rancher during cluster creation. Civo will spin up the Rancher server and import the
cluster as well.
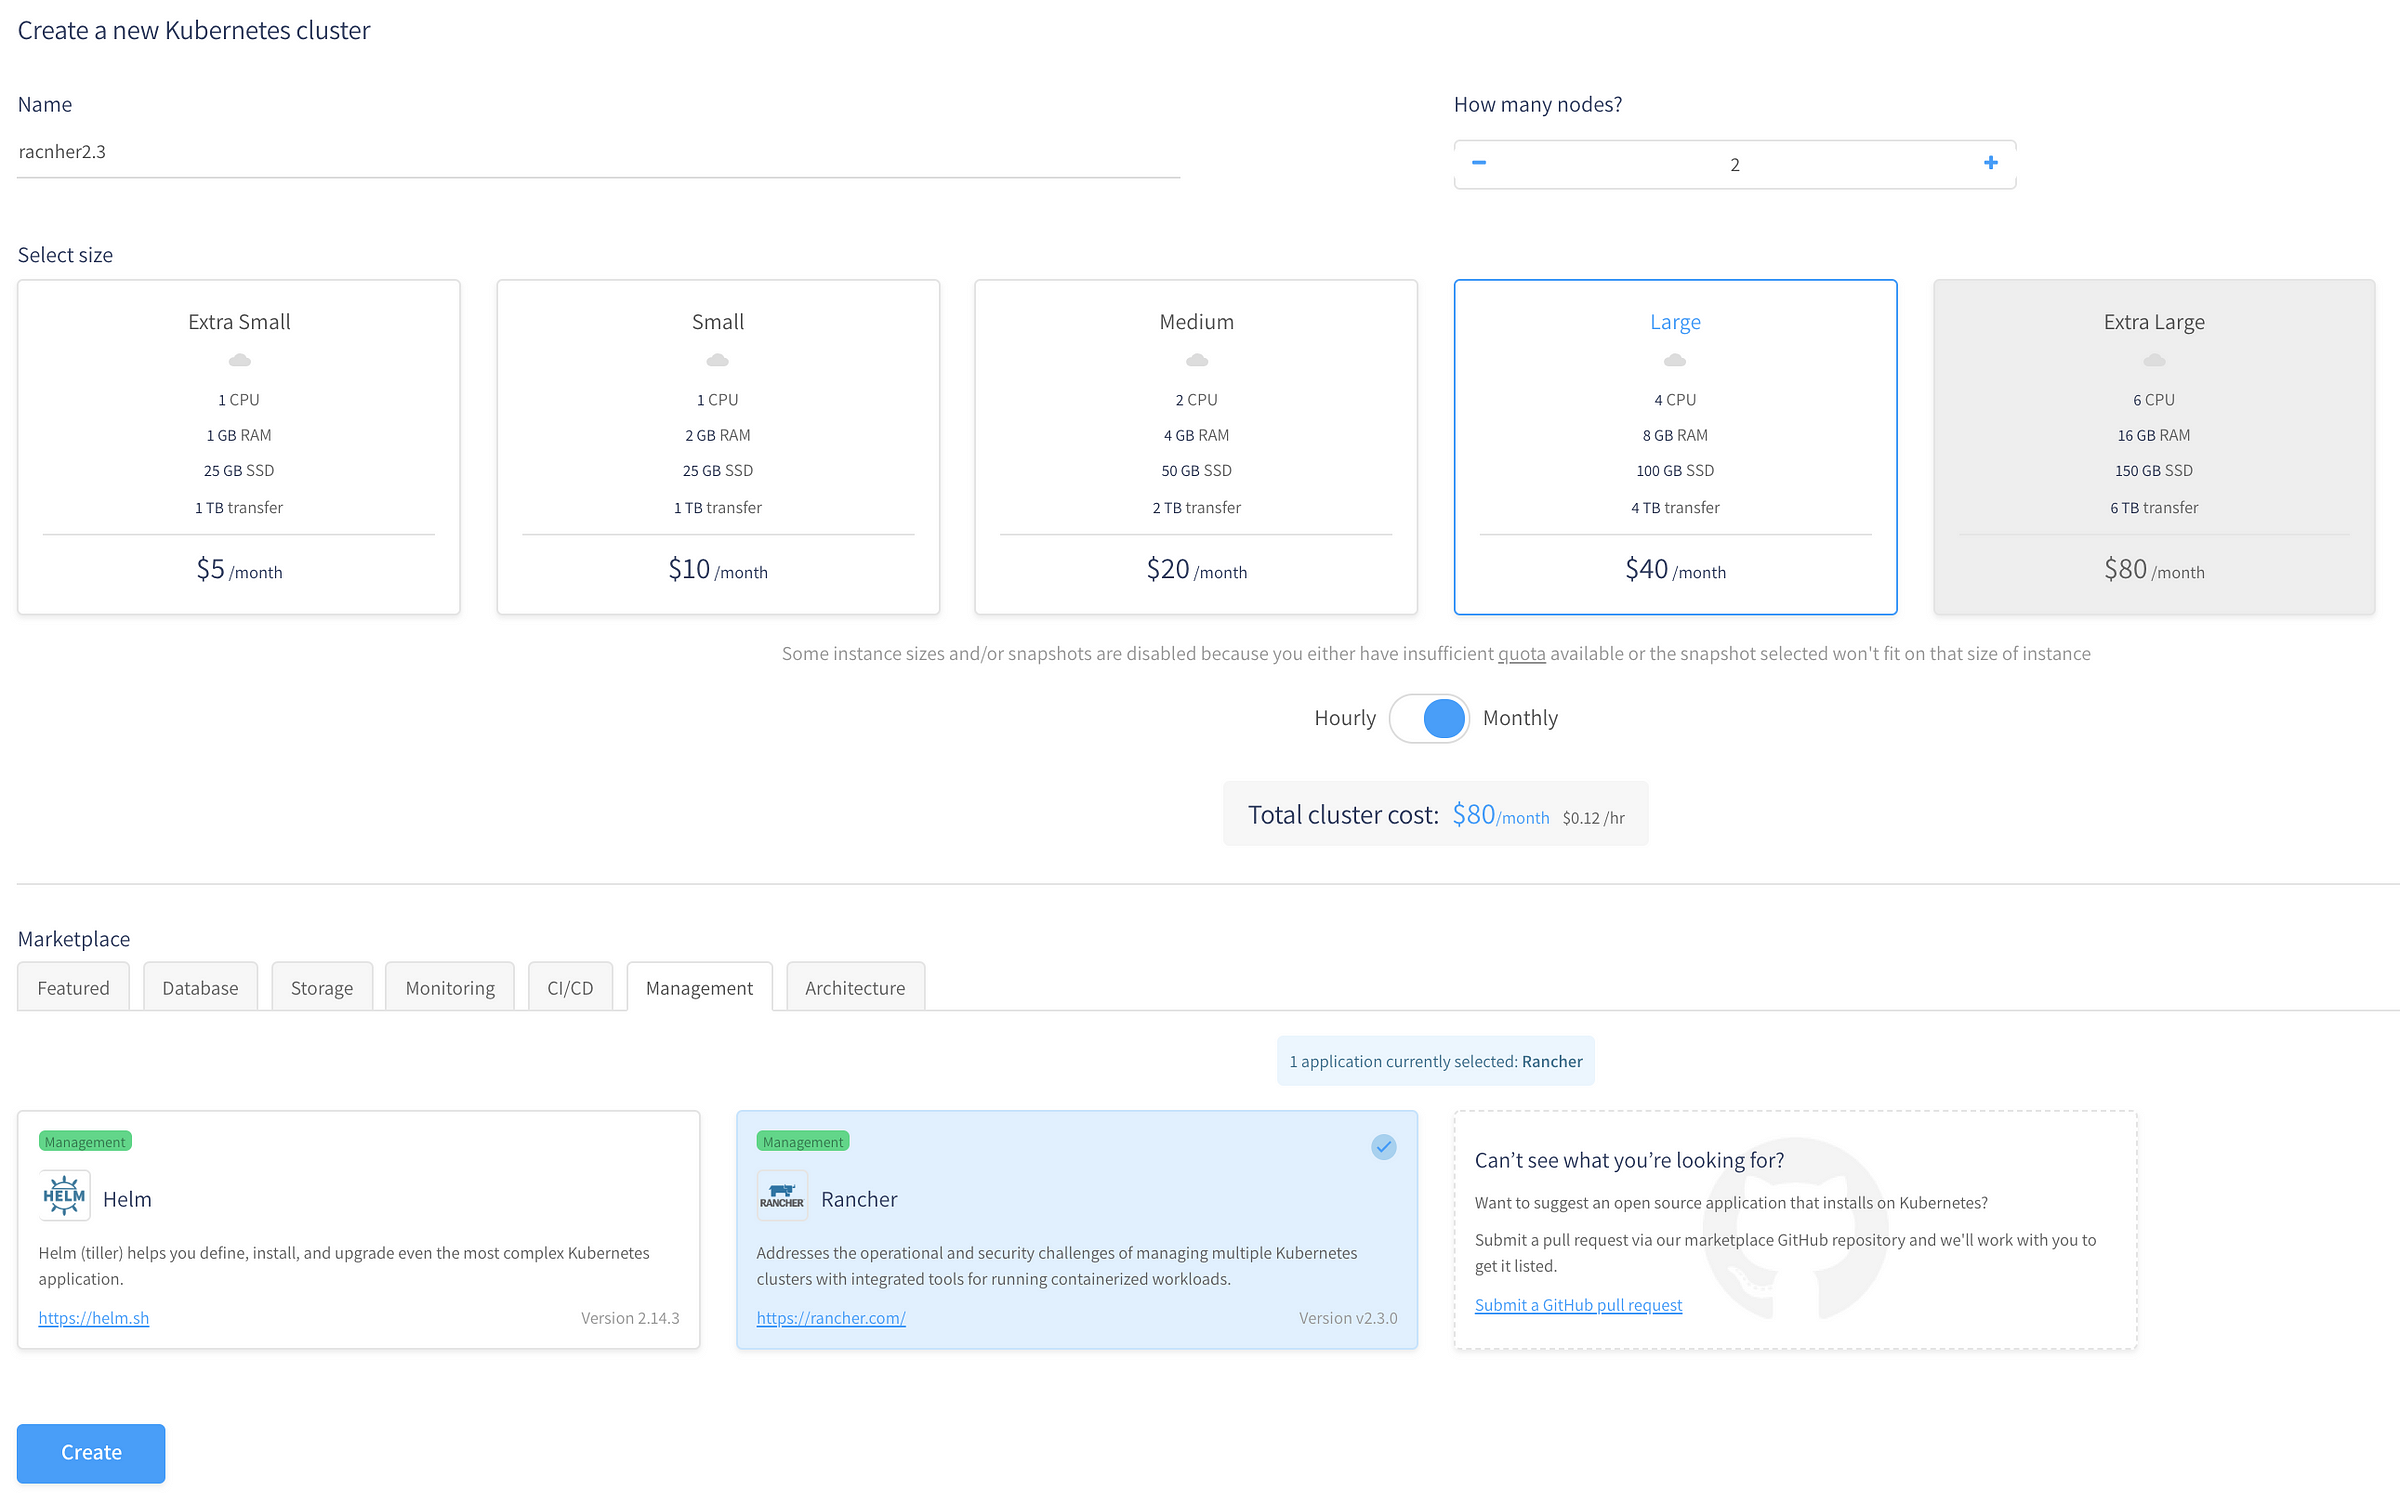
Civo Cluster Creation
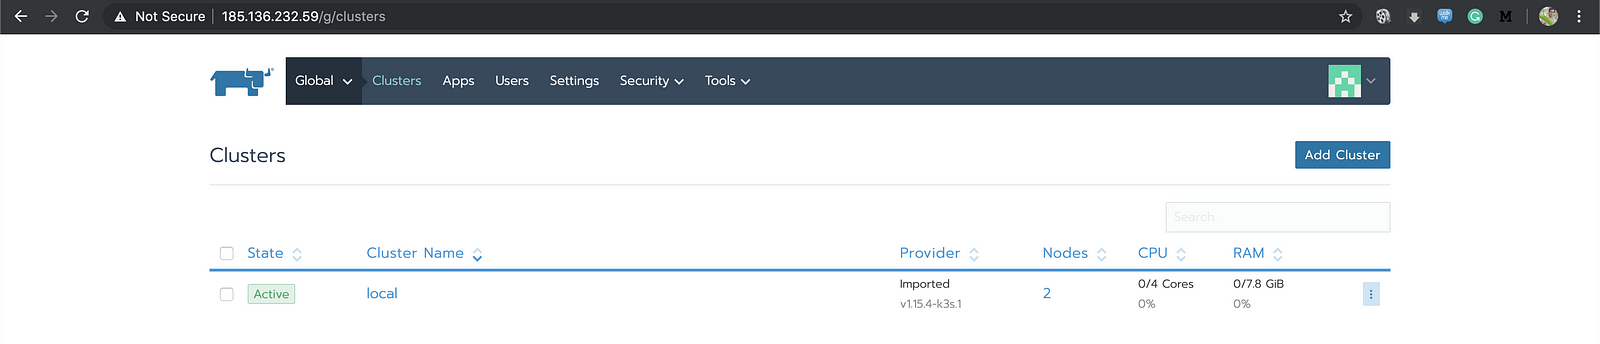
Once you have the cluster ready it will give you the new Rancher 2.3 dashboard
that has support for Istio and Kiali. Let’s dive into the dashboard.
After the cluster creation, you can download kubeconfig, connect to the cluster,
and see if the Rancher server and the cattle-agents are up and running.
kubectl get nodes
NAME               STATUS   ROLES    AGE   VERSION
kube-node-79ed     Ready    worker   96m   v1.15.4-k3s.1
kube-master-bca5   Ready    master   96m   v1.15.4-k3s.1

kubectlg get pods -n cattle-system
NAME                                    READY   STATUS    RESTARTS   AGE
cattle-5669c57dcf-tw65t                 1/1     Running   0          3h27m
cattle-node-agent-8lppr                 1/1     Running   0          3h27m
cattle-node-agent-g5f6f                 1/1     Running   0          3h27m
cattle-cluster-agent-587b6d44cf-ppnjd   1/1     Running   0          3h27m
In order to access the Rancher UI, create an ingress rancher-ingress.yaml as
follows:
>> kubectl apply -f rancher-ingress.yaml
ingress.extensions/cattle-ingress created

kubectl get ingress -n cattle-system

NAME             HOSTS   ADDRESS        PORTS   AGE
cattle-ingress   *       172.31.0.189   80      32s
Now if you go to any of the node ip’s you will see the Rancher server running.
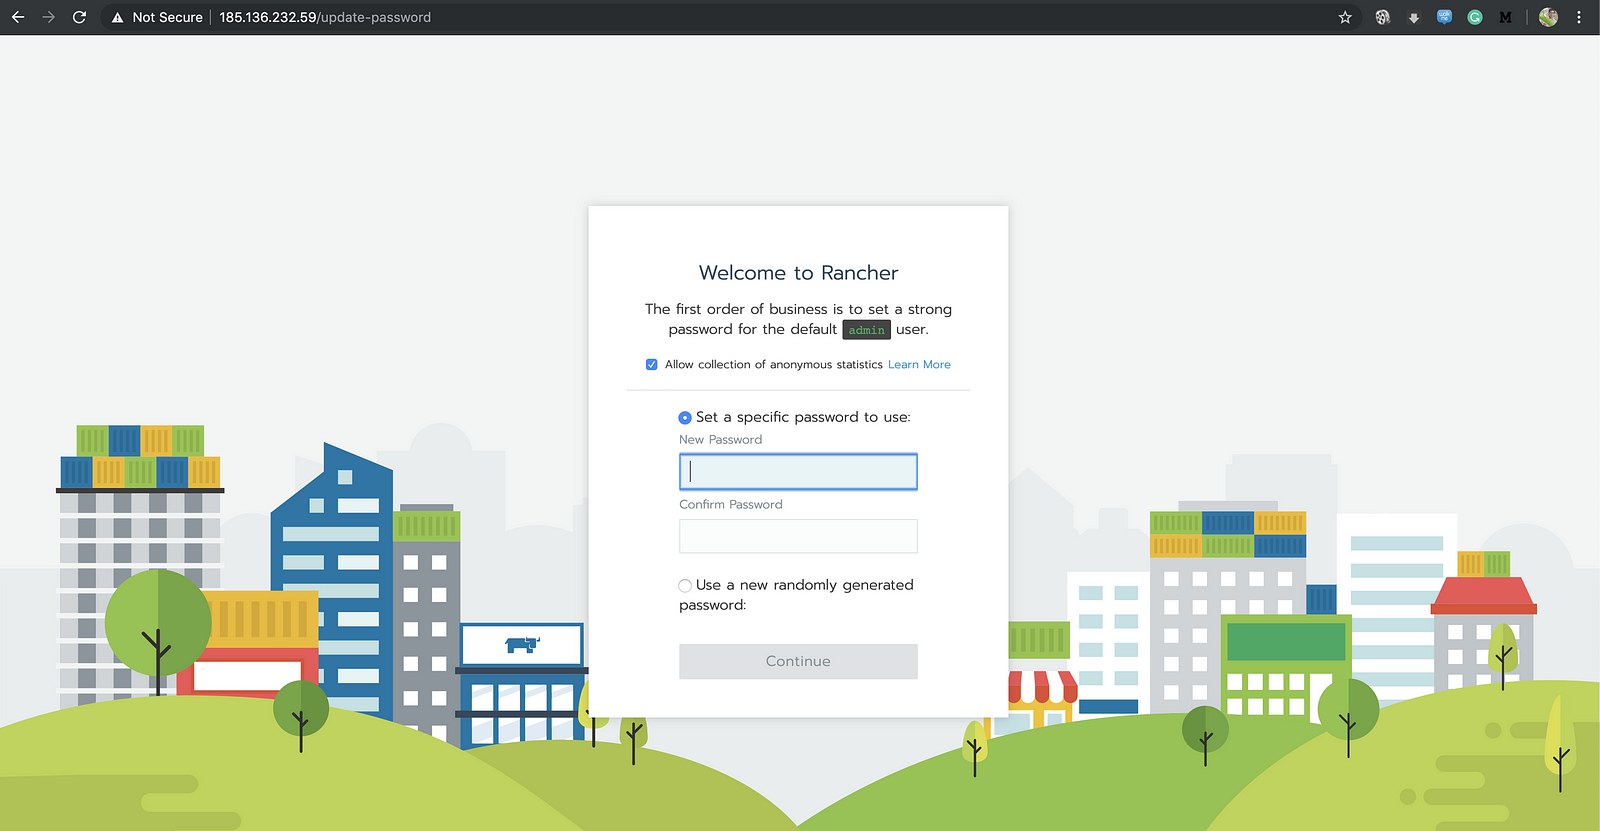
Rancher server
Create a password, save the URL, and you should be able to see the imported
cluster.
ISTIO:
From the documentation:
Cloud platforms provide a wealth of benefits for the
organizations that use them. However, there’s no denying that adopting the cloud
can put strains on DevOps teams. Developers must use microservices to architect
for portability, meanwhile, operators are managing extremely large hybrid and
multi-cloud deployments. Istio lets you connect, secure, control, and observe
services.At a high level, Istio helps reduce the complexity of these deployments and
eases the strain on your development teams. It is a completely open-source
service mesh that layers transparently onto existing distributed applications.
It is also a platform, including APIs that let it integrate into any logging
platform, or telemetry or policy system. Istio’s diverse feature set lets you
successfully, and efficiently, run a distributed microservice architecture, and
provides a uniform way to secure, connect, and monitor microservices.
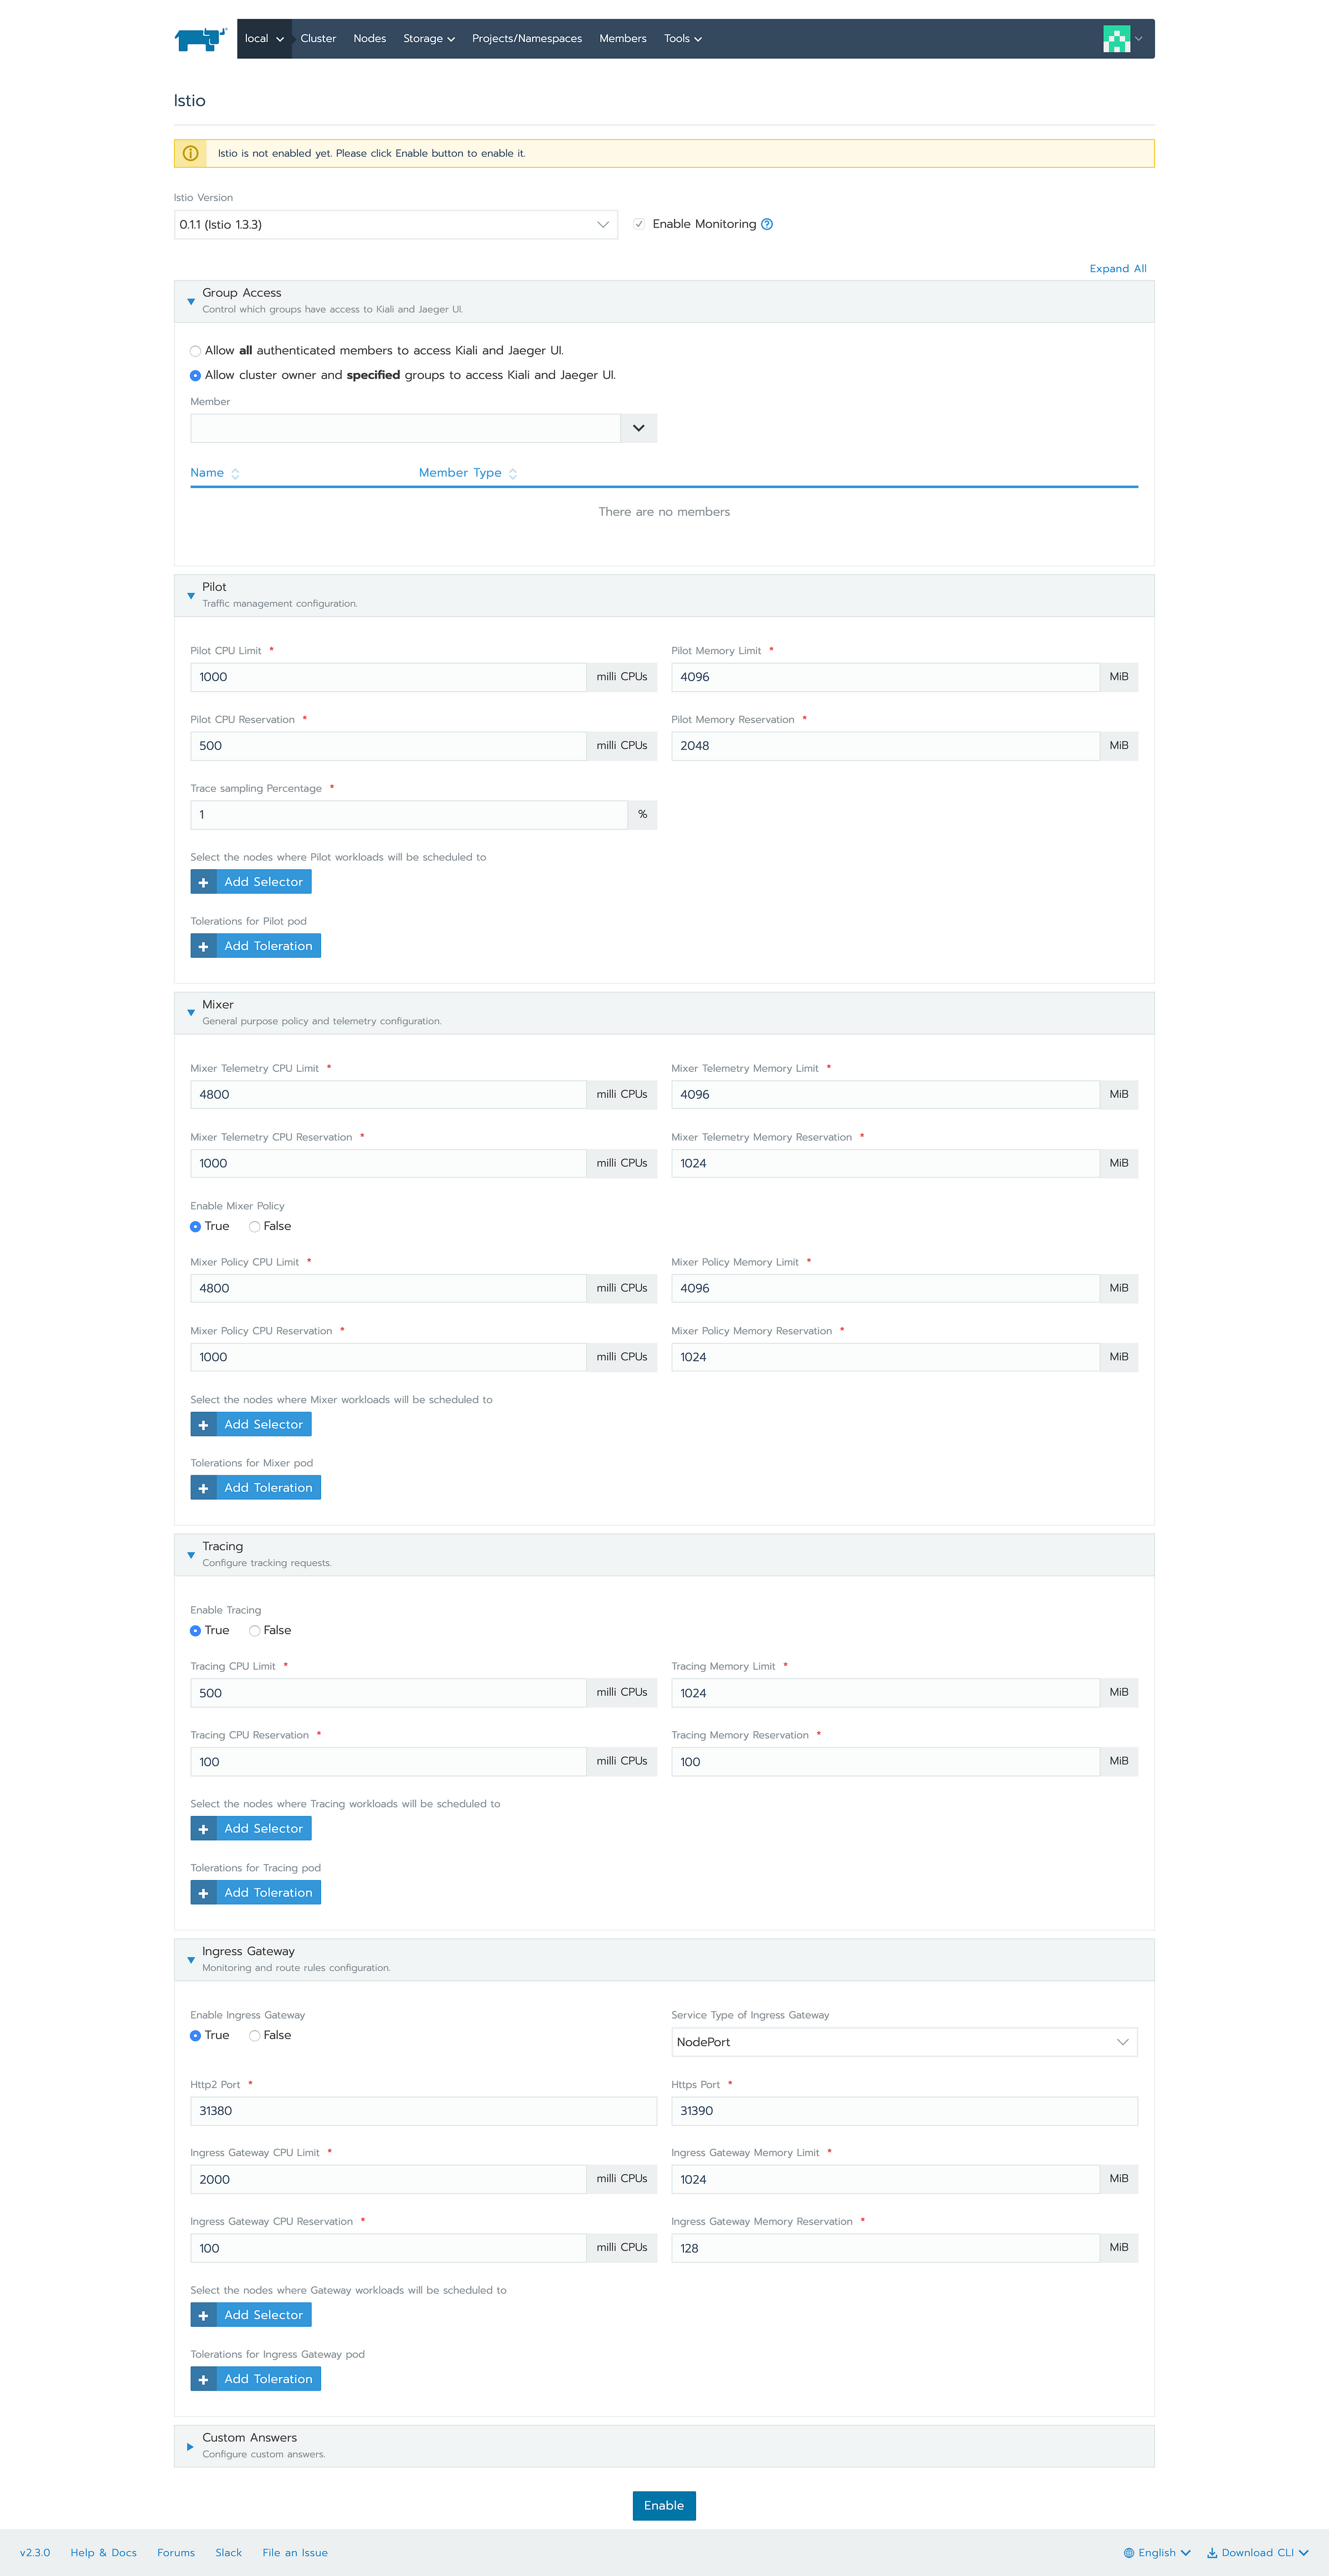
Let us enable Istio from the Rancher UI and see the deployments.
To enable Istio, you need to go to Tools > Istio. There are a lot of
configuration options that you can change accordingly. For now, we will keep
everything default and set ingress gateway to True. Enabling this will also
enable monitoring, which is a pre-requisite for Istio to work.
After enabling, you can see monitoring and Istio pods coming up under the
namespaces cattle-prometheus(for monitoring) and istio-system(for istio)
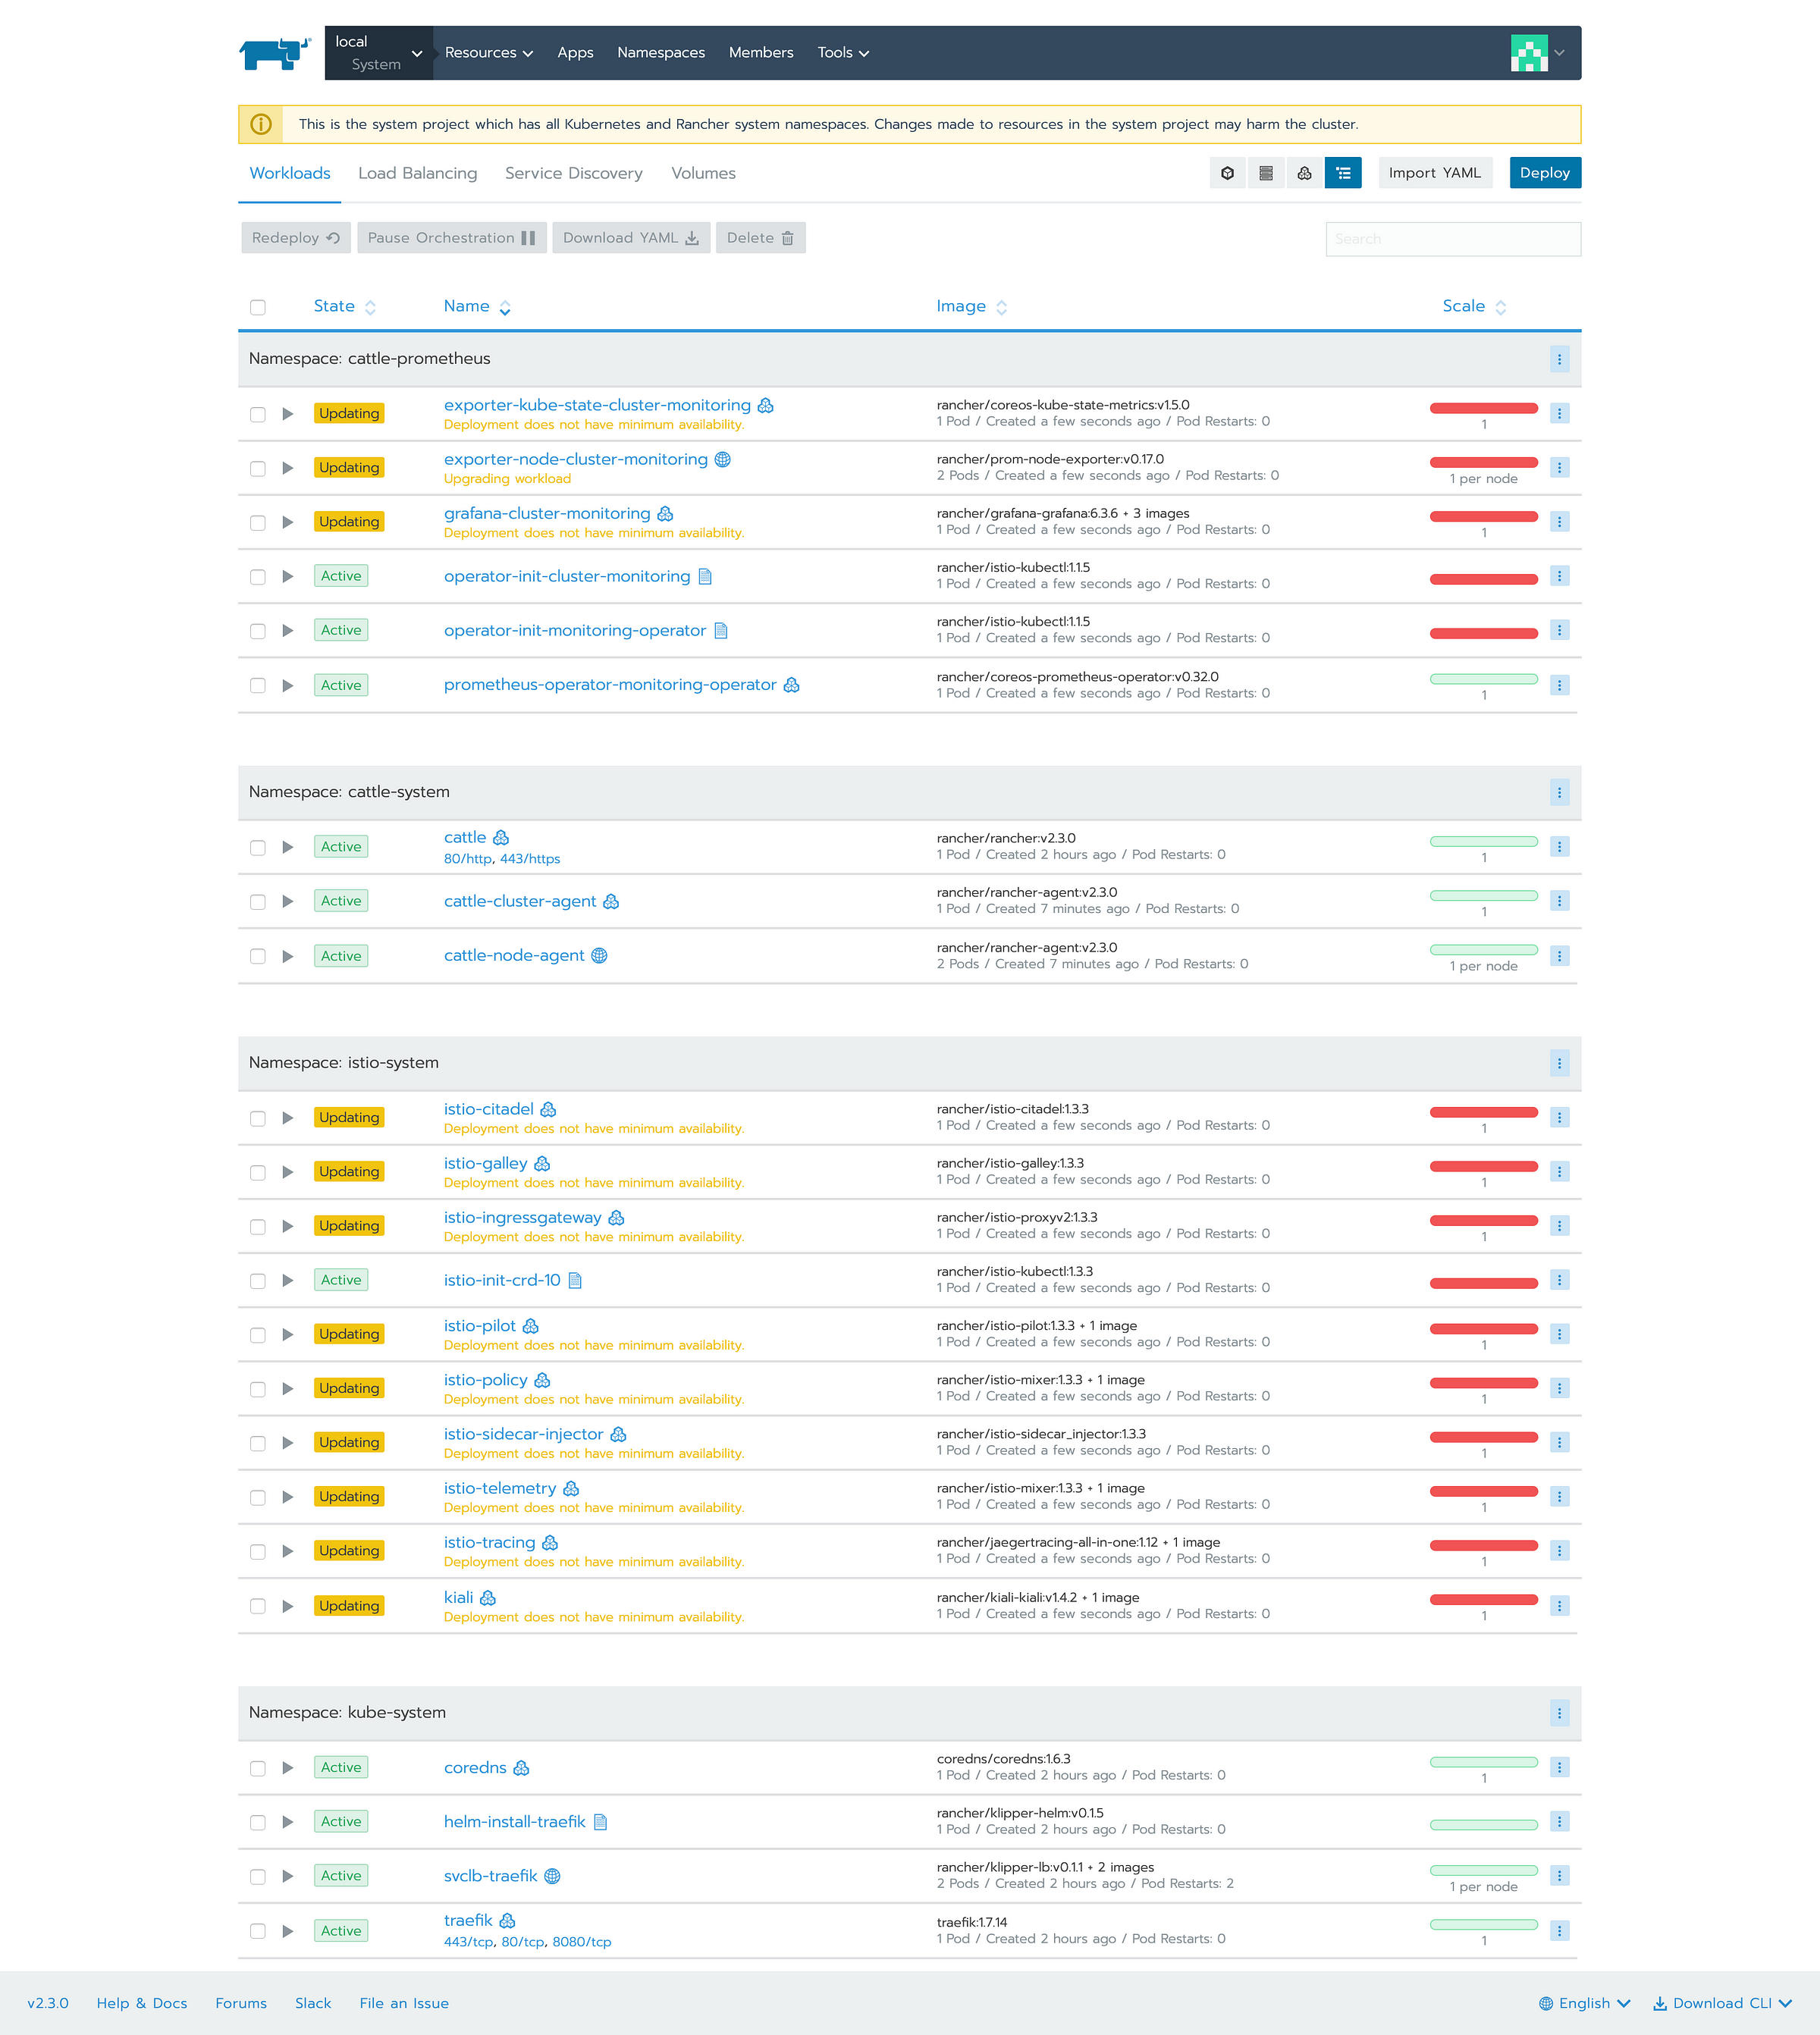
>> kubectl get pods -n istio-system

NAME                                      READY   STATUS    RESTARTS   AGE
istio-citadel-6bb9c9f6fb-md9f8            1/1     Running   0          6m16s
istio-tracing-64d646945-xm4sm             2/2     Running   0          6m15s
istio-policy-68959c7999-5kmdb             2/2     Running   1          6m16s
istio-galley-67848cd58-g5tbt              1/1     Running   0          6m16s
kiali-5f8f876bd5-6djxf                    2/2     Running   0          6m16s
istio-telemetry-778bfdcf74-ps9vl          2/2     Running   1          6m16s
istio-pilot-7546b9fdcc-rbxj8              2/2     Running   0          6m16s
istio-ingressgateway-6f877dd689-rskn4     1/1     Running   0          6m16s
istio-sidecar-injector-69c97ddbb5-x7jcv   1/1     Running   0          6m16s

>> kubectl get pods -n cattle-prometheus
NAME                                                       READY   STATUS    RESTARTS   AGE
prometheus-operator-monitoring-operator-79484b9c6f-zshlq   1/1     Running   0          7m42s
exporter-node-cluster-monitoring-wnxtc                     1/1     Running   0          7m39s
exporter-node-cluster-monitoring-k68fb                     1/1     Running   0          7m39s
grafana-cluster-monitoring-5d676d89c5-vkbzm                2/2     Running   0          7m39s
prometheus-cluster-monitoring-0                            5/5     Running   1          7m15s
exporter-kube-state-cluster-monitoring-5dfd658dc-pn8mt     1/1     Running   0          7m39s
Now let us do a sample Istio deployment, generate traffic and see it in the Kiali
dashboard.
We will create the deployment, Gateway, and Virtual Service for
a sample application as follows:
kubectl  label namespace default istio-injection=enabled
namespace/default labeled

kubectl  apply -f

service/details created
serviceaccount/bookinfo-details created
deployment.apps/details-v1 created
service/ratings created
serviceaccount/bookinfo-ratings created
deployment.apps/ratings-v1 created
service/reviews created
serviceaccount/bookinfo-reviews created
deployment.apps/reviews-v1 created
deployment.apps/reviews-v2 created
deployment.apps/reviews-v3 created
service/productpage created
serviceaccount/bookinfo-productpage created
deployment.apps/productpage-v1 created

kubectl  apply -f
gateway.networking.istio.io/bookinfo-gateway created

kubectl  apply -f
virtualservice.networking.istio.io/bookinfo created
Generate Traffic:
Now when the application is deployed, you can see
them via the Istio gateway:
>> kubectl  get pods

NAME                              READY   STATUS    RESTARTS   AGE

details-v1-74f858558f-m5tsx       2/2     Running   0          10m
ratings-v1-7855f5bcb9-lkhgg       2/2     Running   0          10m
productpage-v1-8554d58bff-llnqh   2/2     Running   0          10m|
reviews-v2-d6cfdb7d6-rl4zk        2/2     Running   0          10m
reviews-v3-75699b5cfb-crdrd       2/2     Running   0          10m
reviews-v1-59fd8b965b-rmct2       2/2     Running   0          10m

>> kubectl get svc

NAME          TYPE        CLUSTER-IP        EXTERNAL-IP   PORT(S)    AGE
kubernetes    ClusterIP   192.168.128.1     <none>        443/TCP    140m
details       ClusterIP   192.168.154.118   <none>        9080/TCP   10m
ratings       ClusterIP   192.168.207.69    <none>        9080/TCP   10m
reviews       ClusterIP   192.168.141.42    <none>        9080/TCP   10m
productpage   ClusterIP   192.168.128.87    <none>        9080/TCP   10m
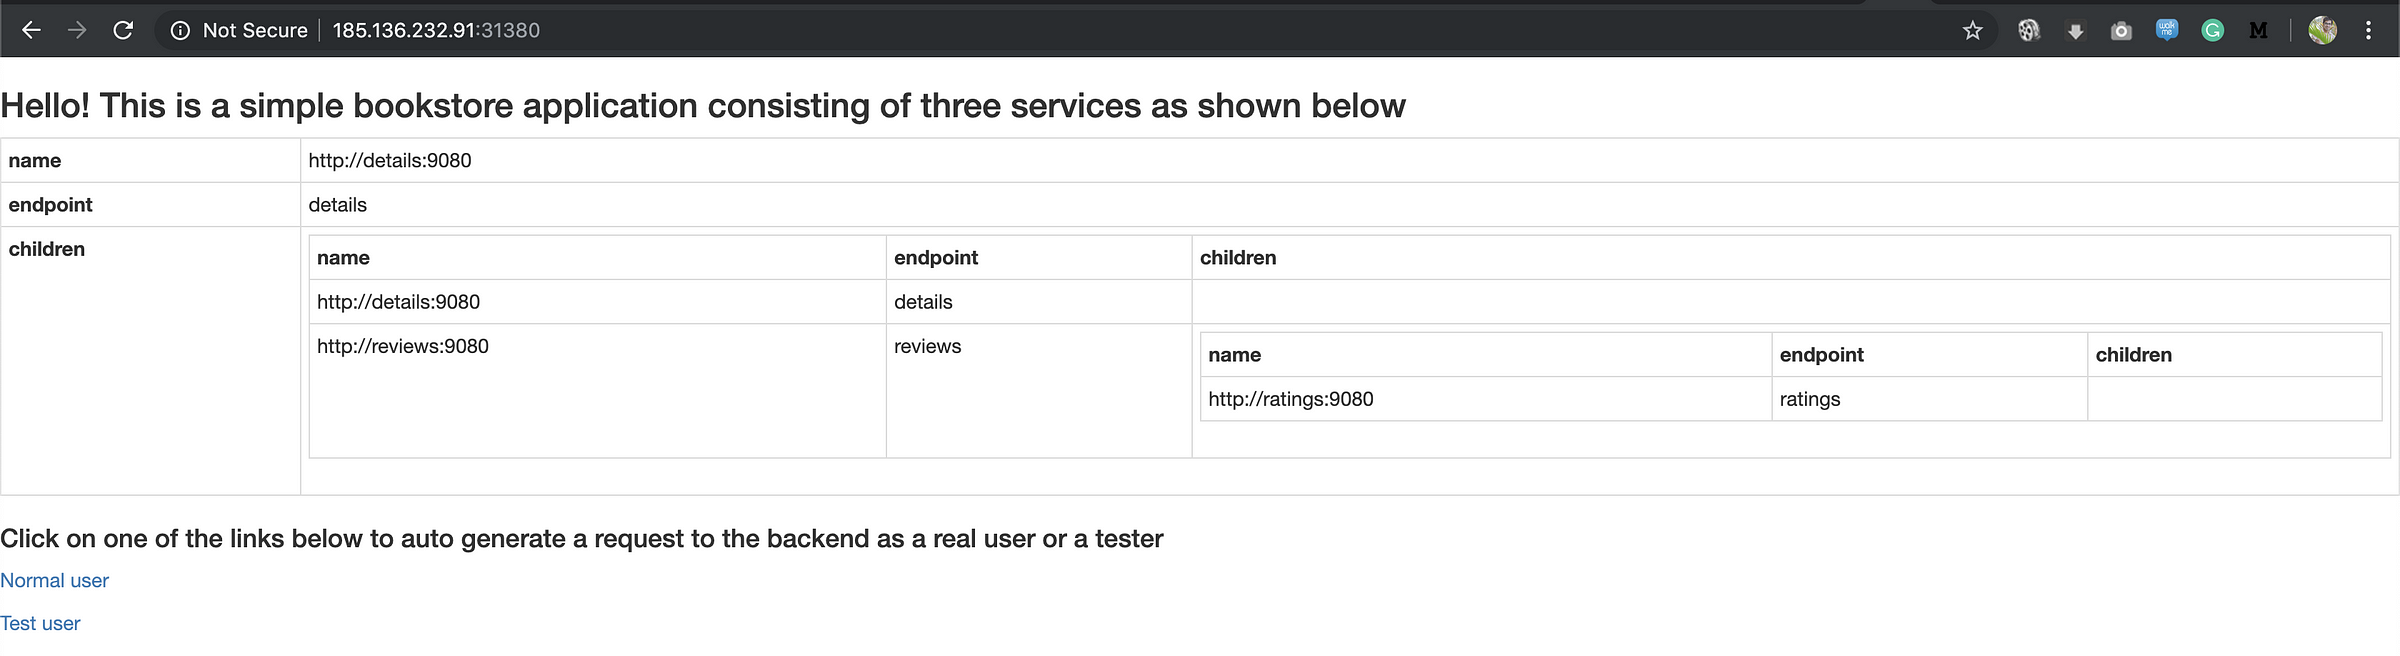
Sample App
Let us generate some traffic by clicking Test user and Normal User.
From the Resources tab, select Istio. You can see the graphs.
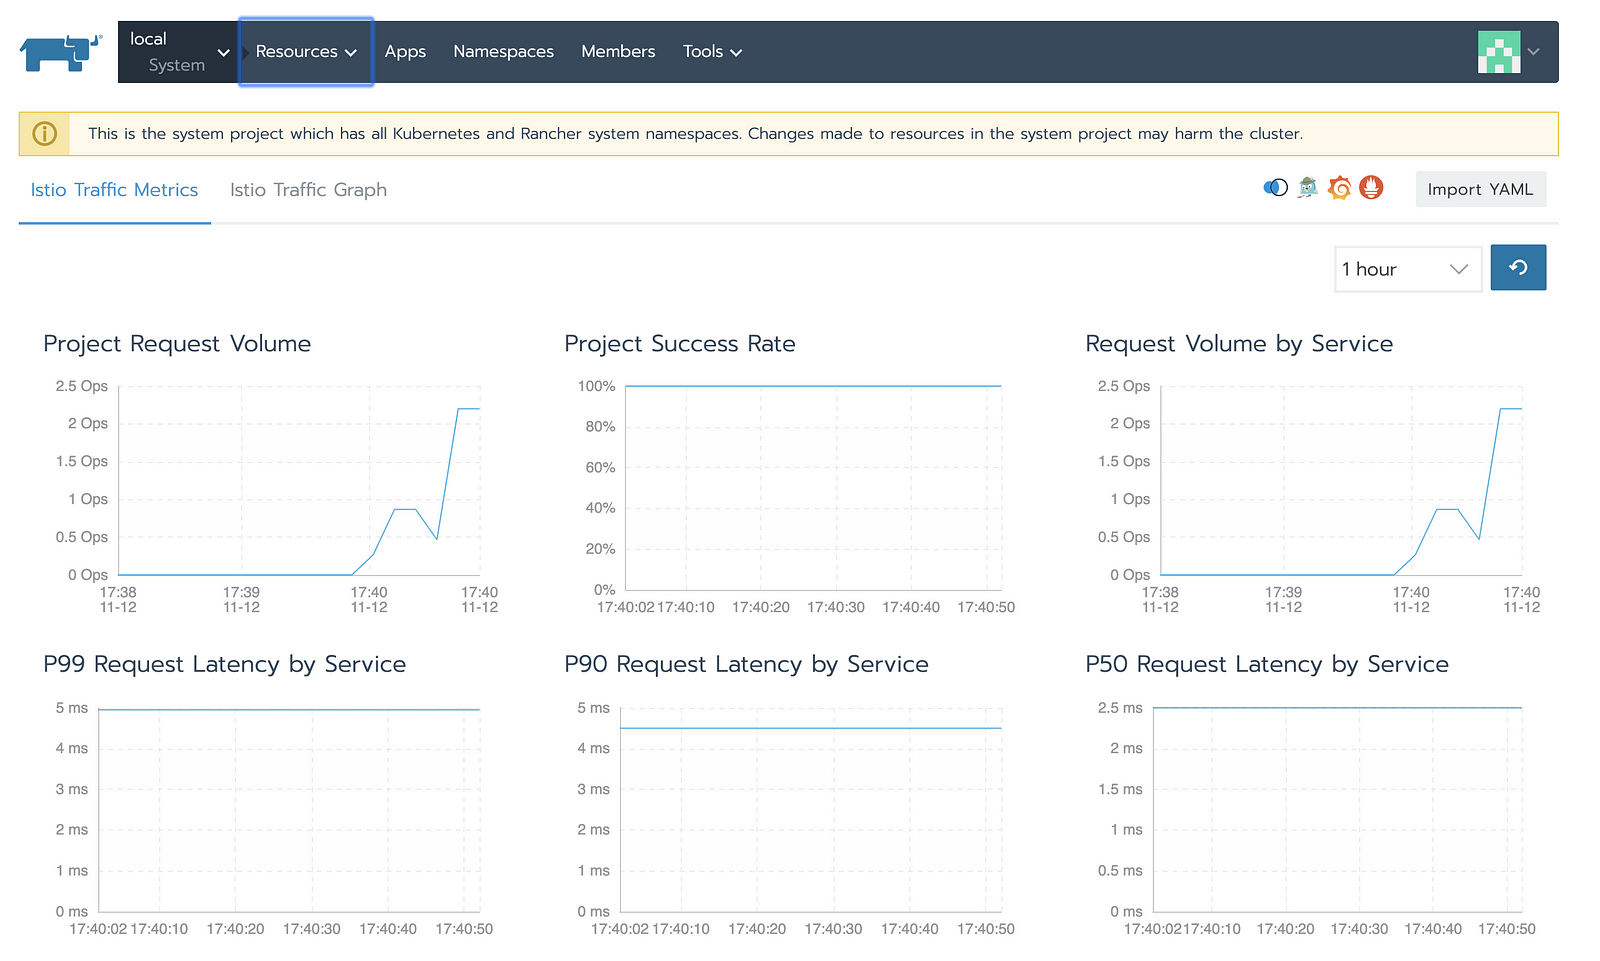
From the icons on the screen, click the Kiali Icon.
Kiali:
Kiali is an observability console for Istio with service mesh configuration
capabilities. It helps you to understand the structure of your service mesh by
inferring the topology, and also provides the health of your mesh. Kiali
provides detailed metrics, and a basic Grafana integration is available for
advanced queries. Distributed tracing is provided by integrating Jaeger.
You can see the complete topology of the application deployed and how the flow
is.
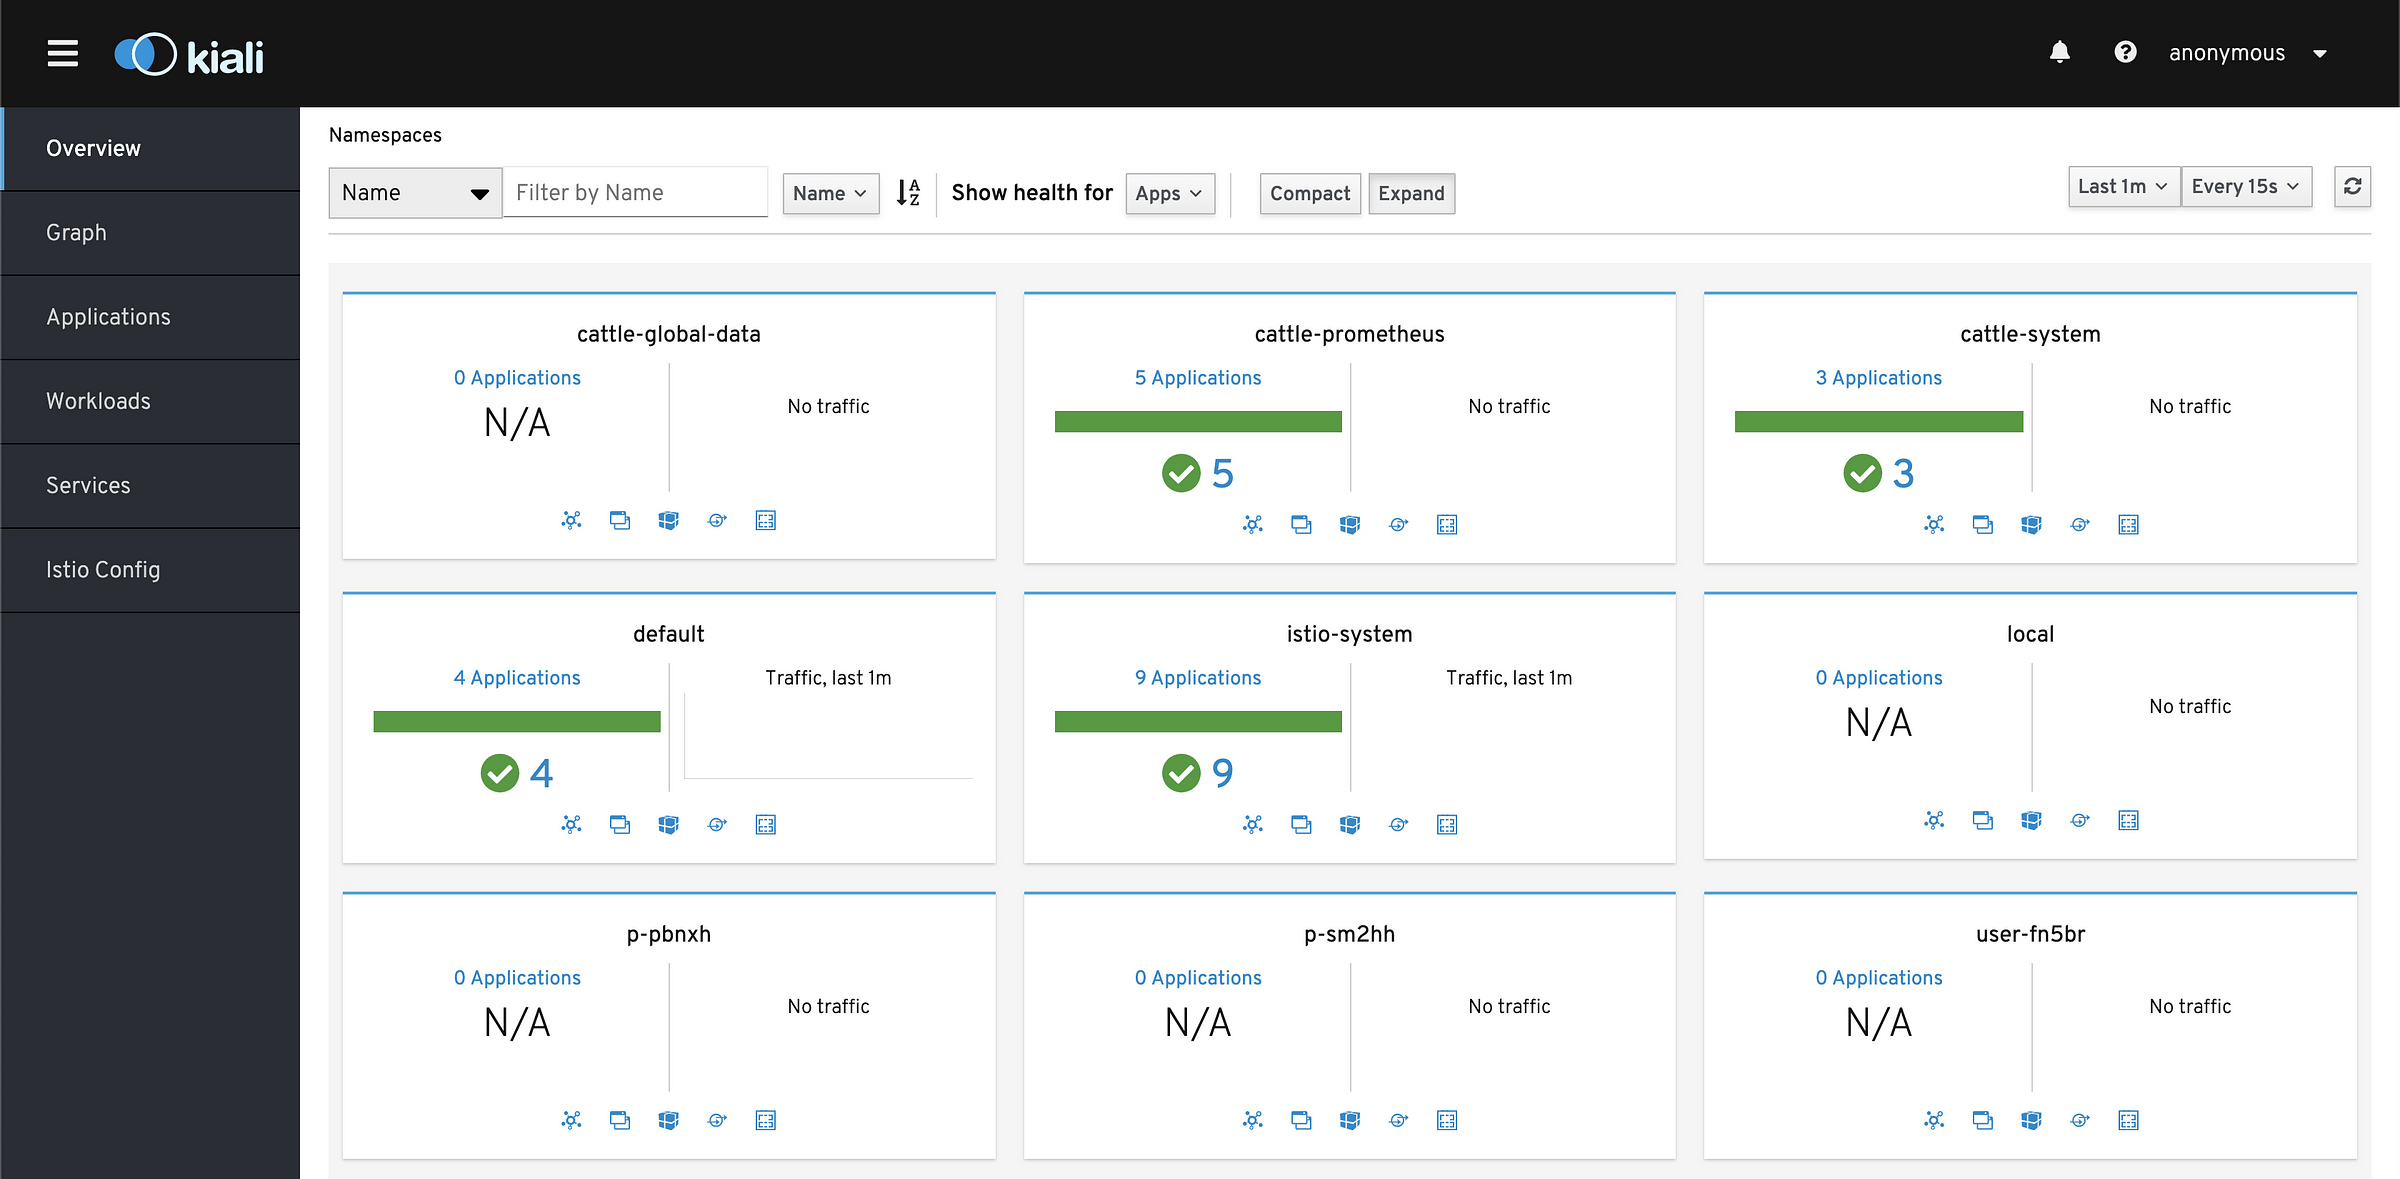
basic kiali view
Below is the Application deployed graph:
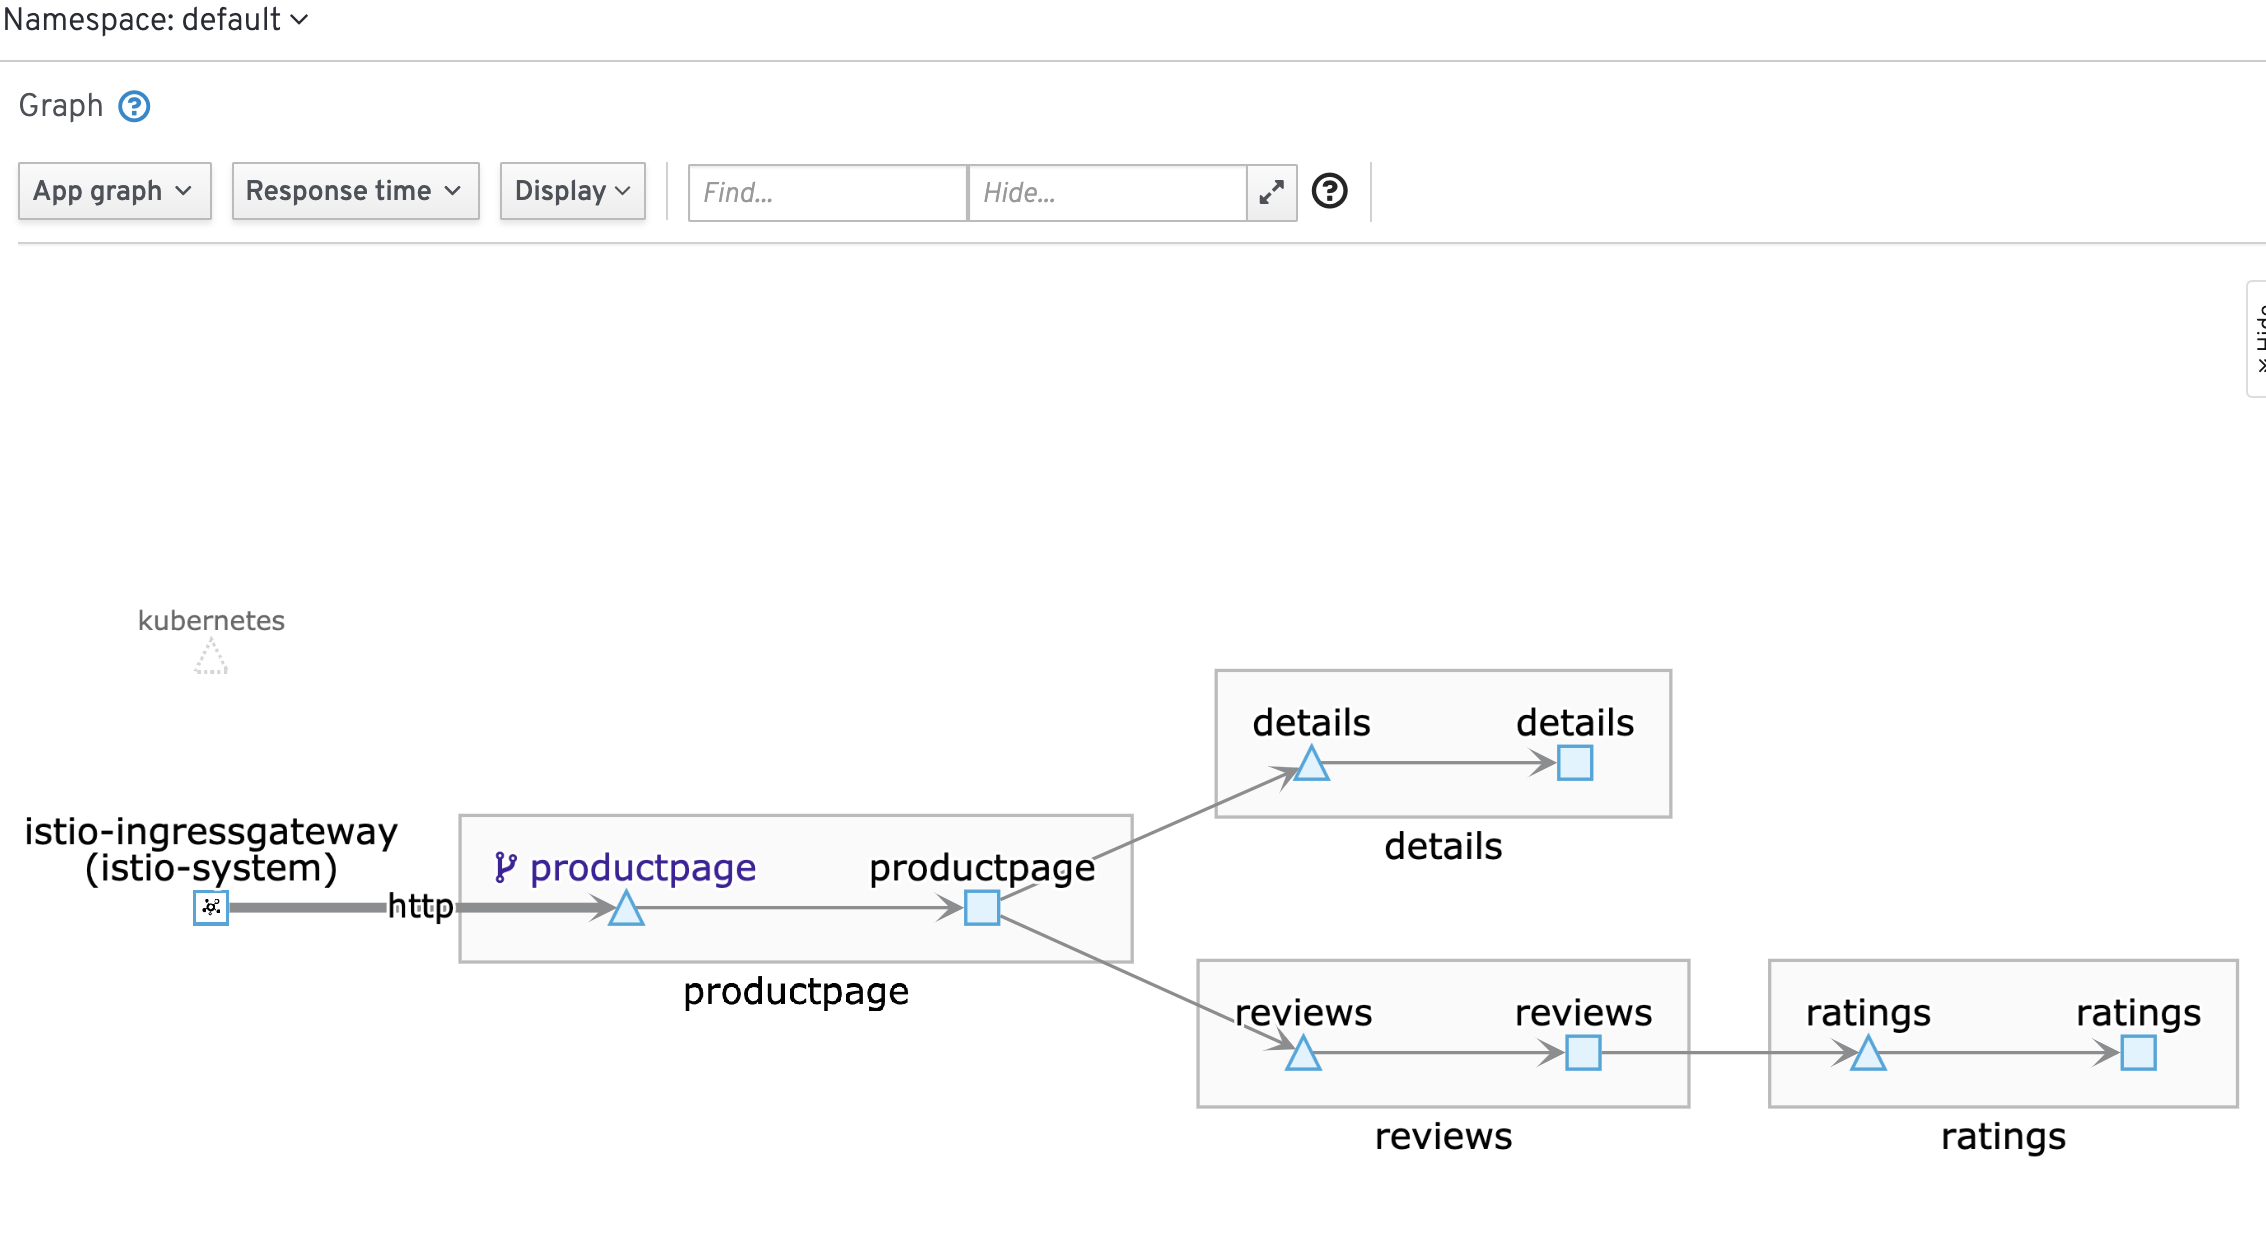
app graph
Some other graph views:
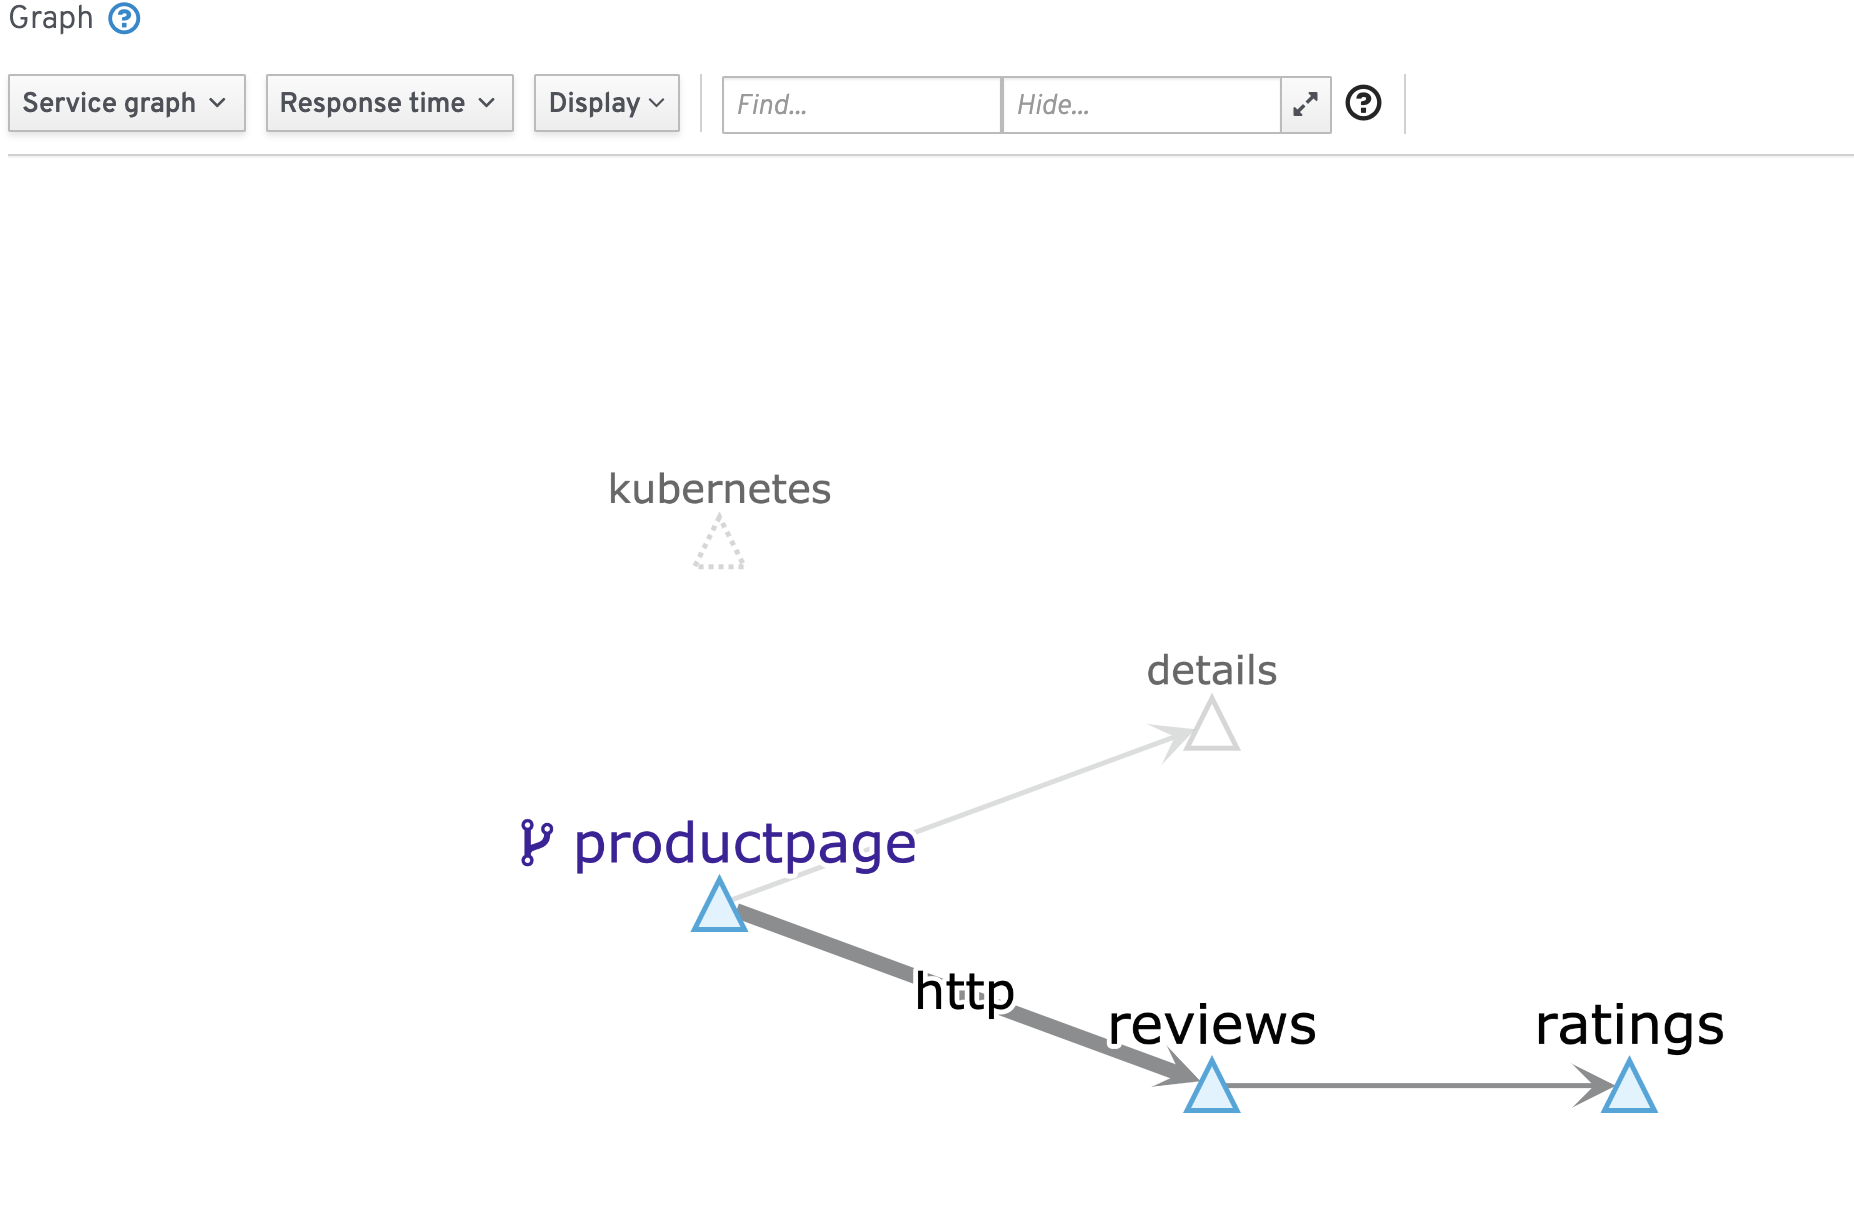
service graph
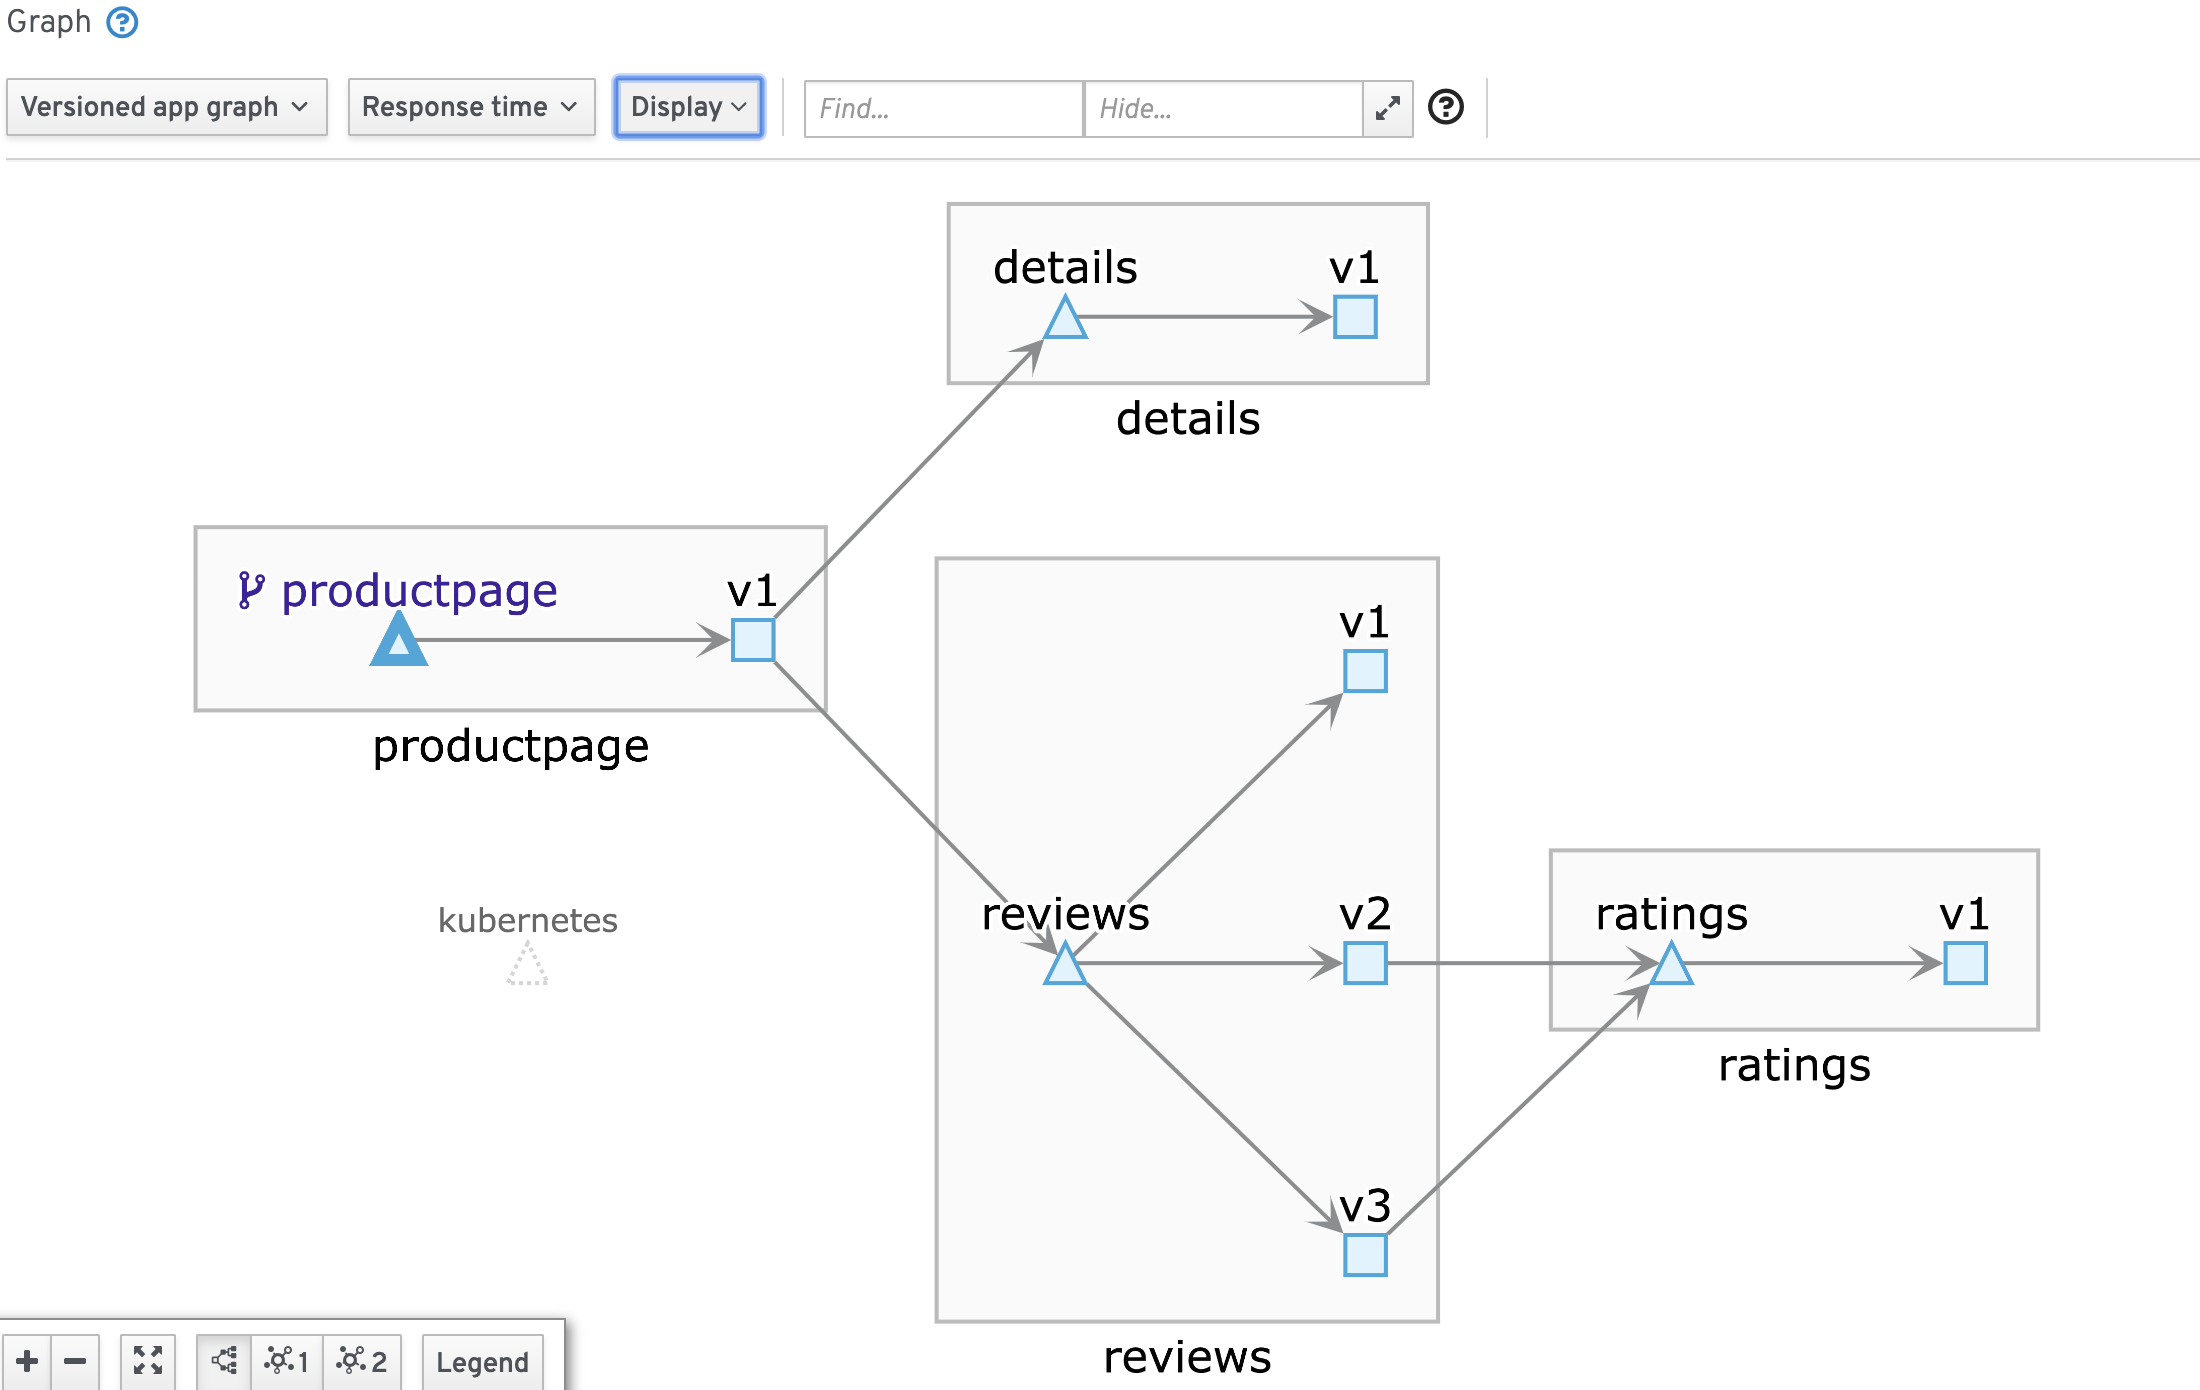
versioned app graph
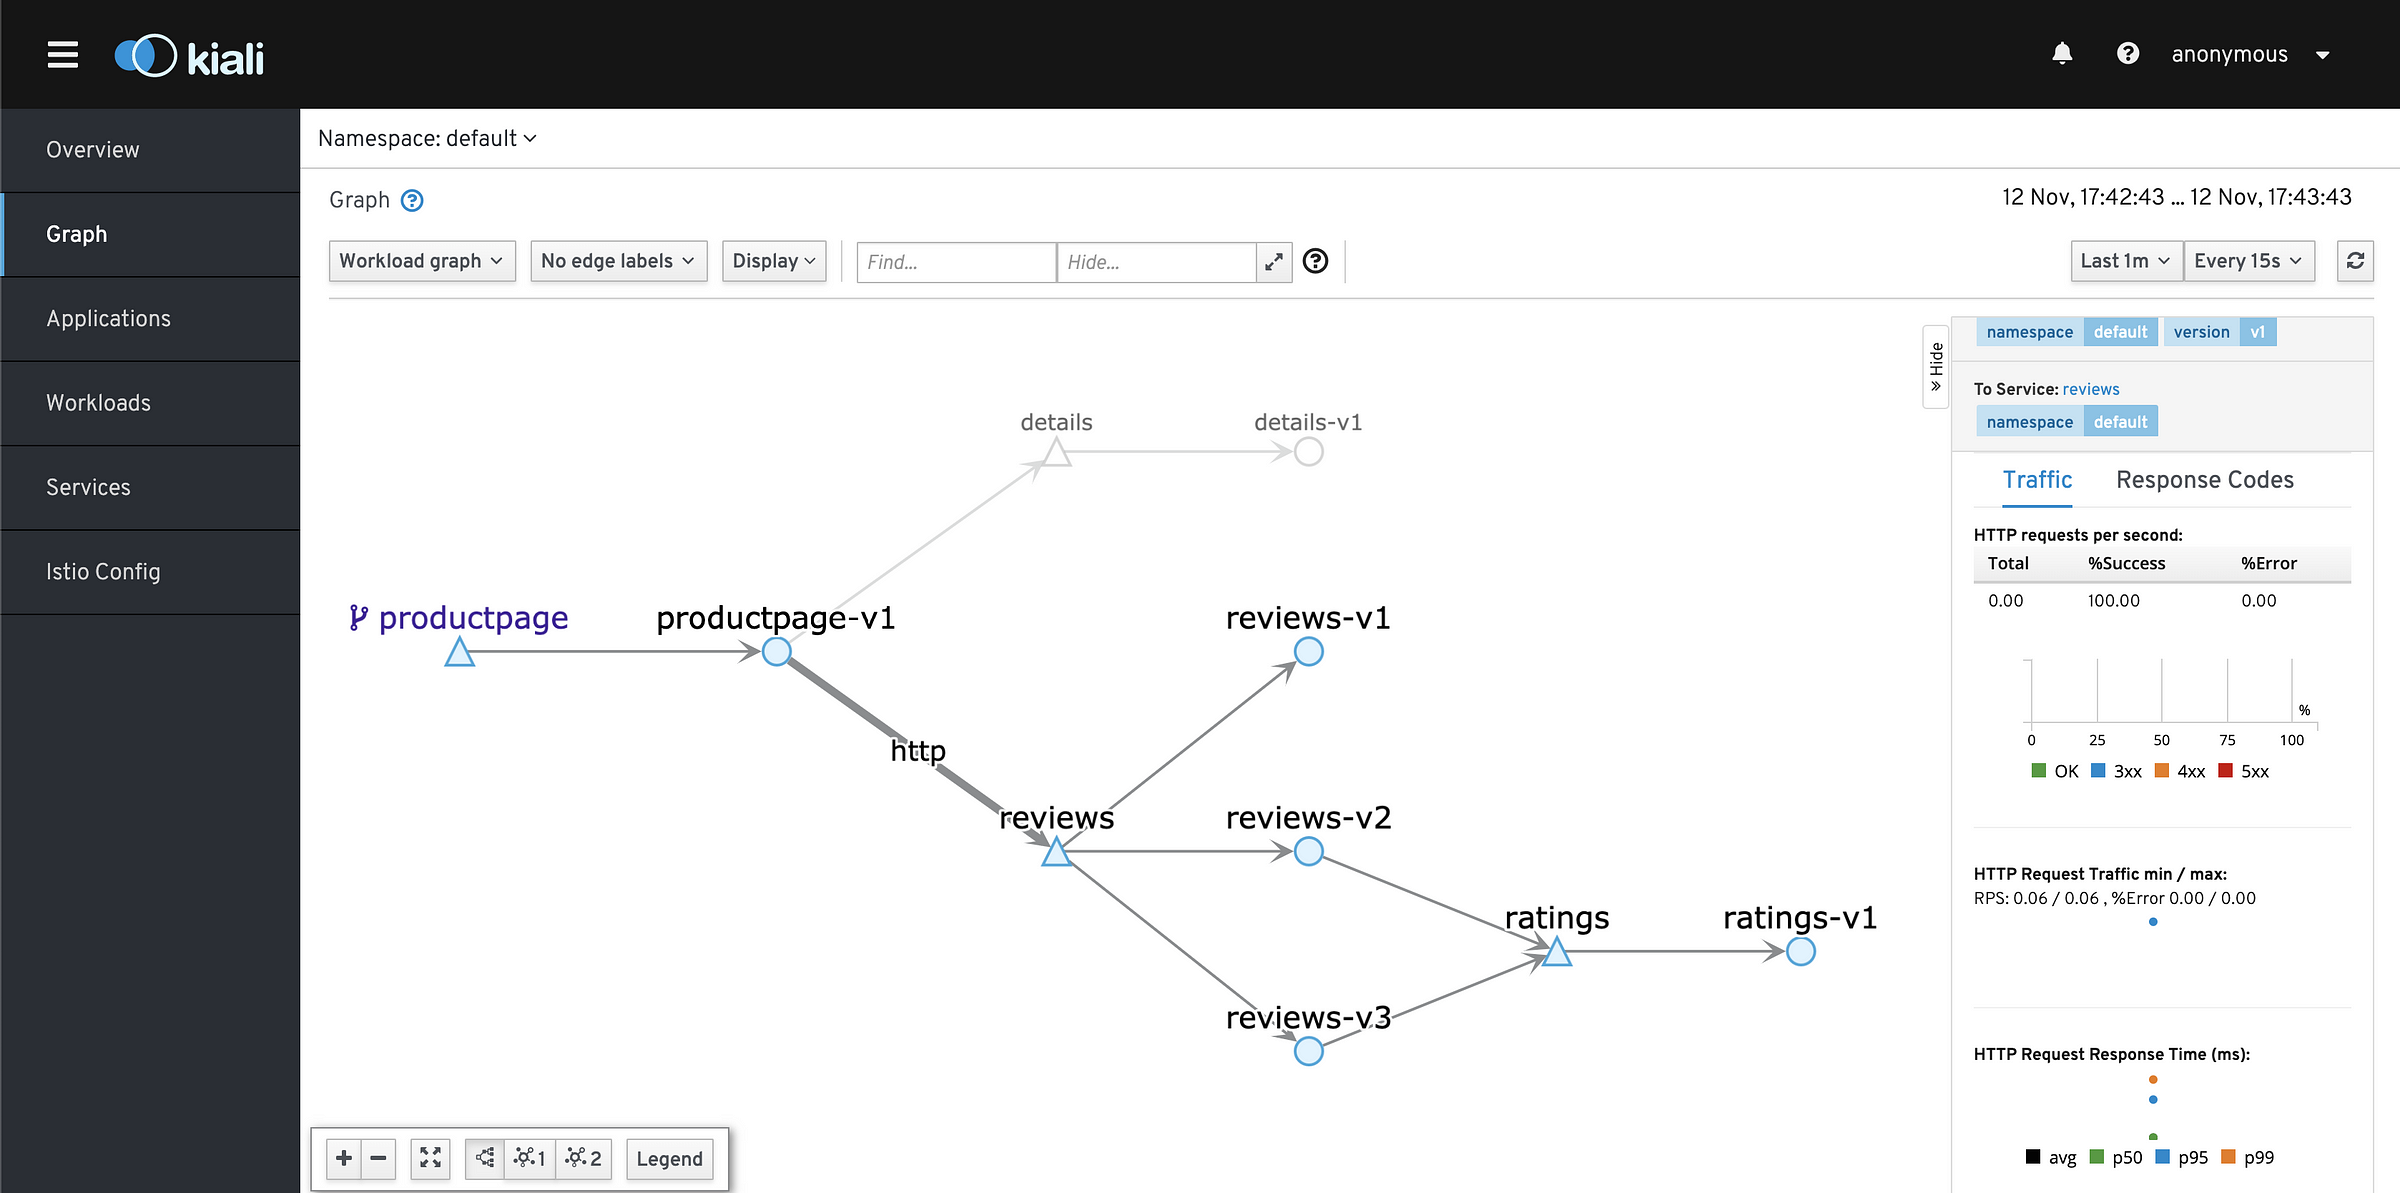
workload graph
Jaeger:
From the Docs -> Jaeger, inspired by
Dapper and
OpenZipkin, is a distributed tracing system released as
open source by Uber Technologies. It is used for
monitoring and troubleshooting microservices-based distributed systems,
including:
- Distributed context propagation
- Distributed transaction monitoring
- Root cause analysis
- Service dependency analysis
- Performance / latency optimization
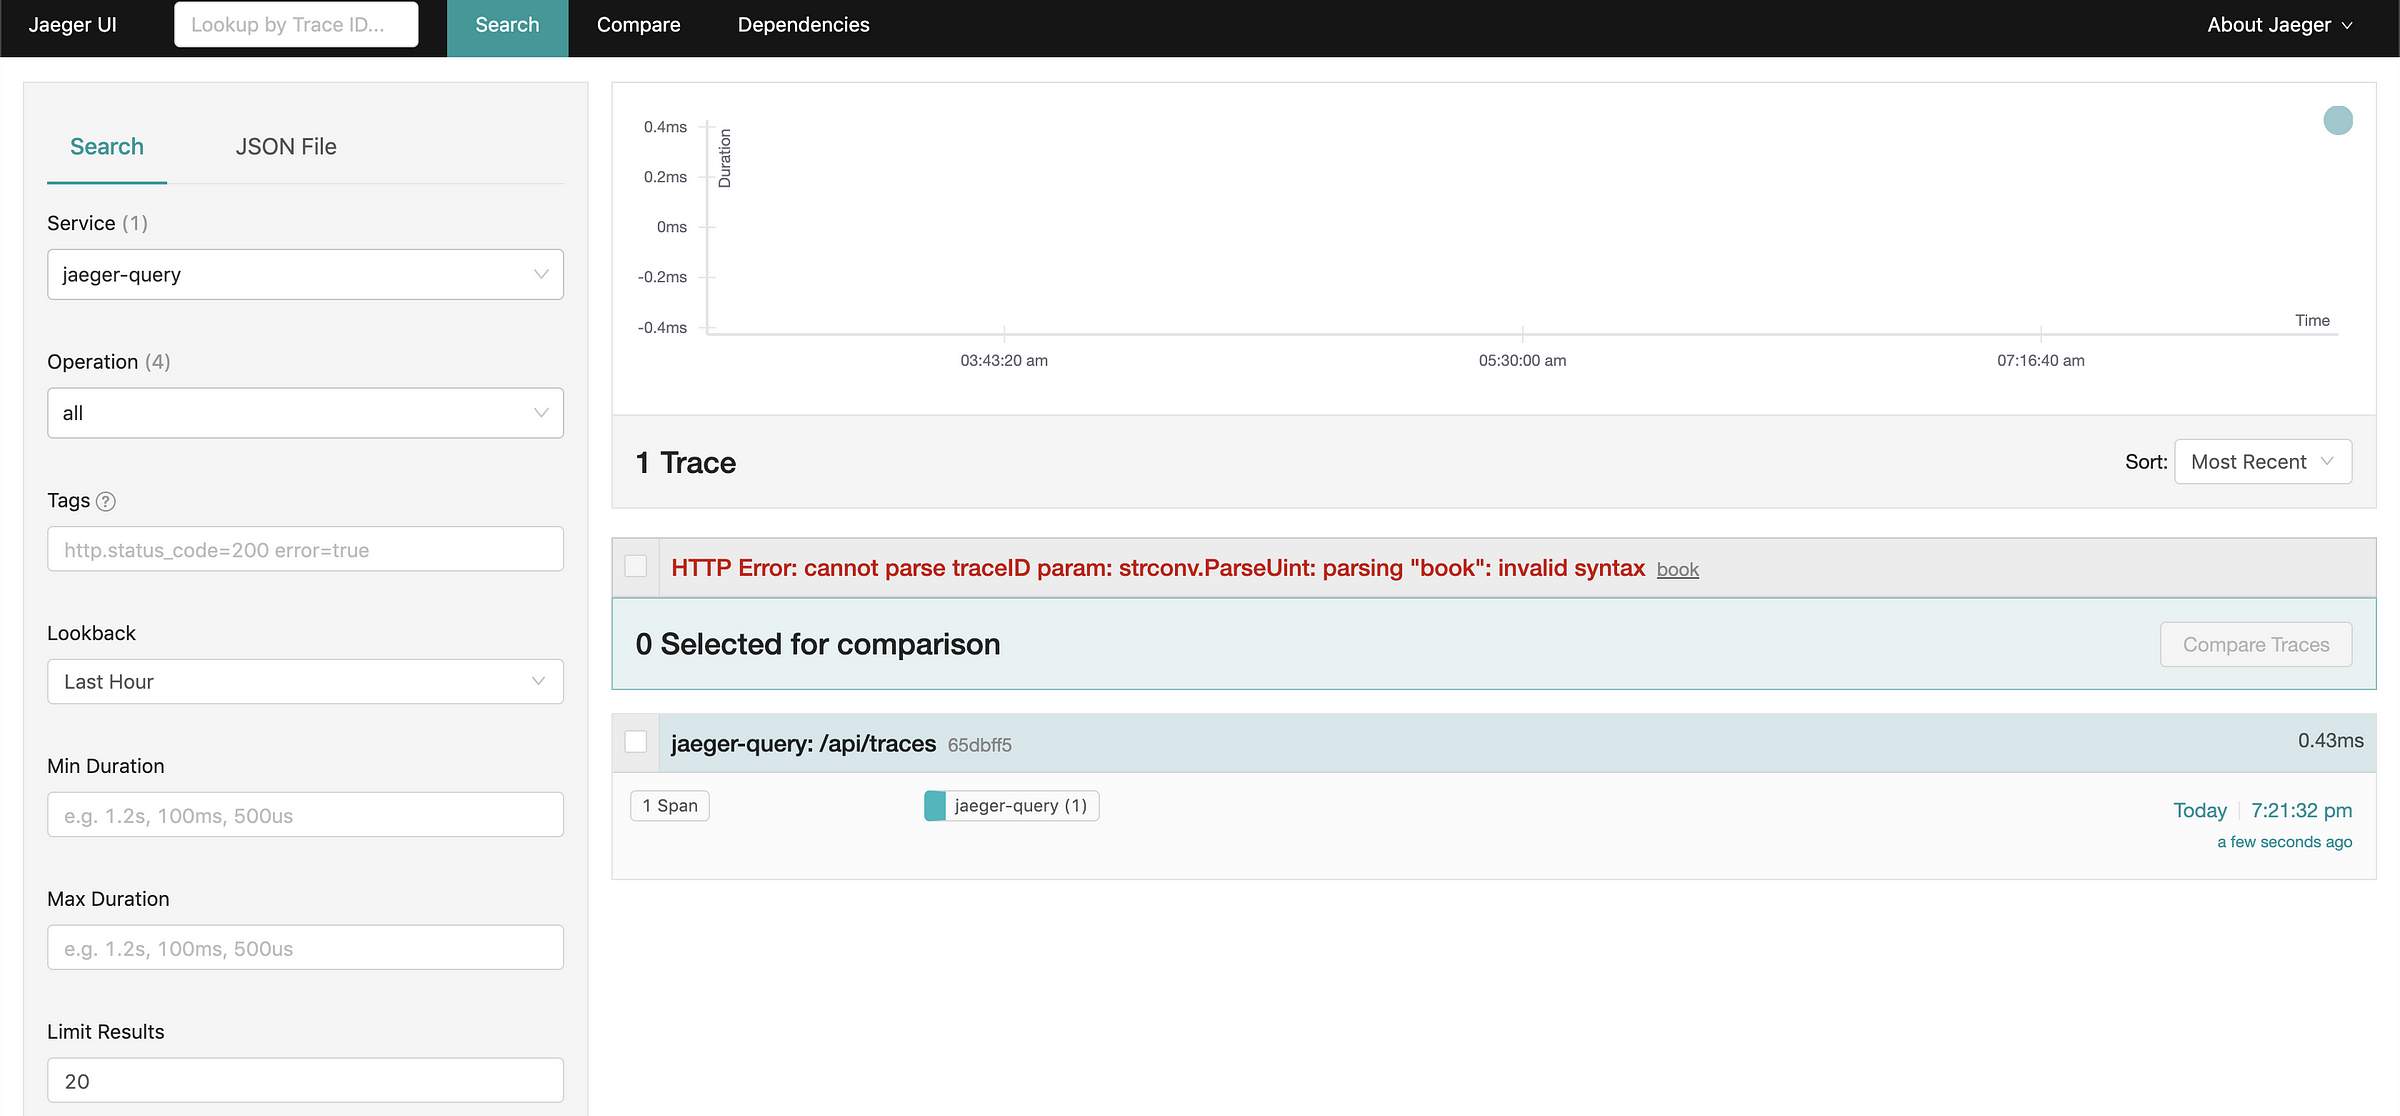
Jaeger UI
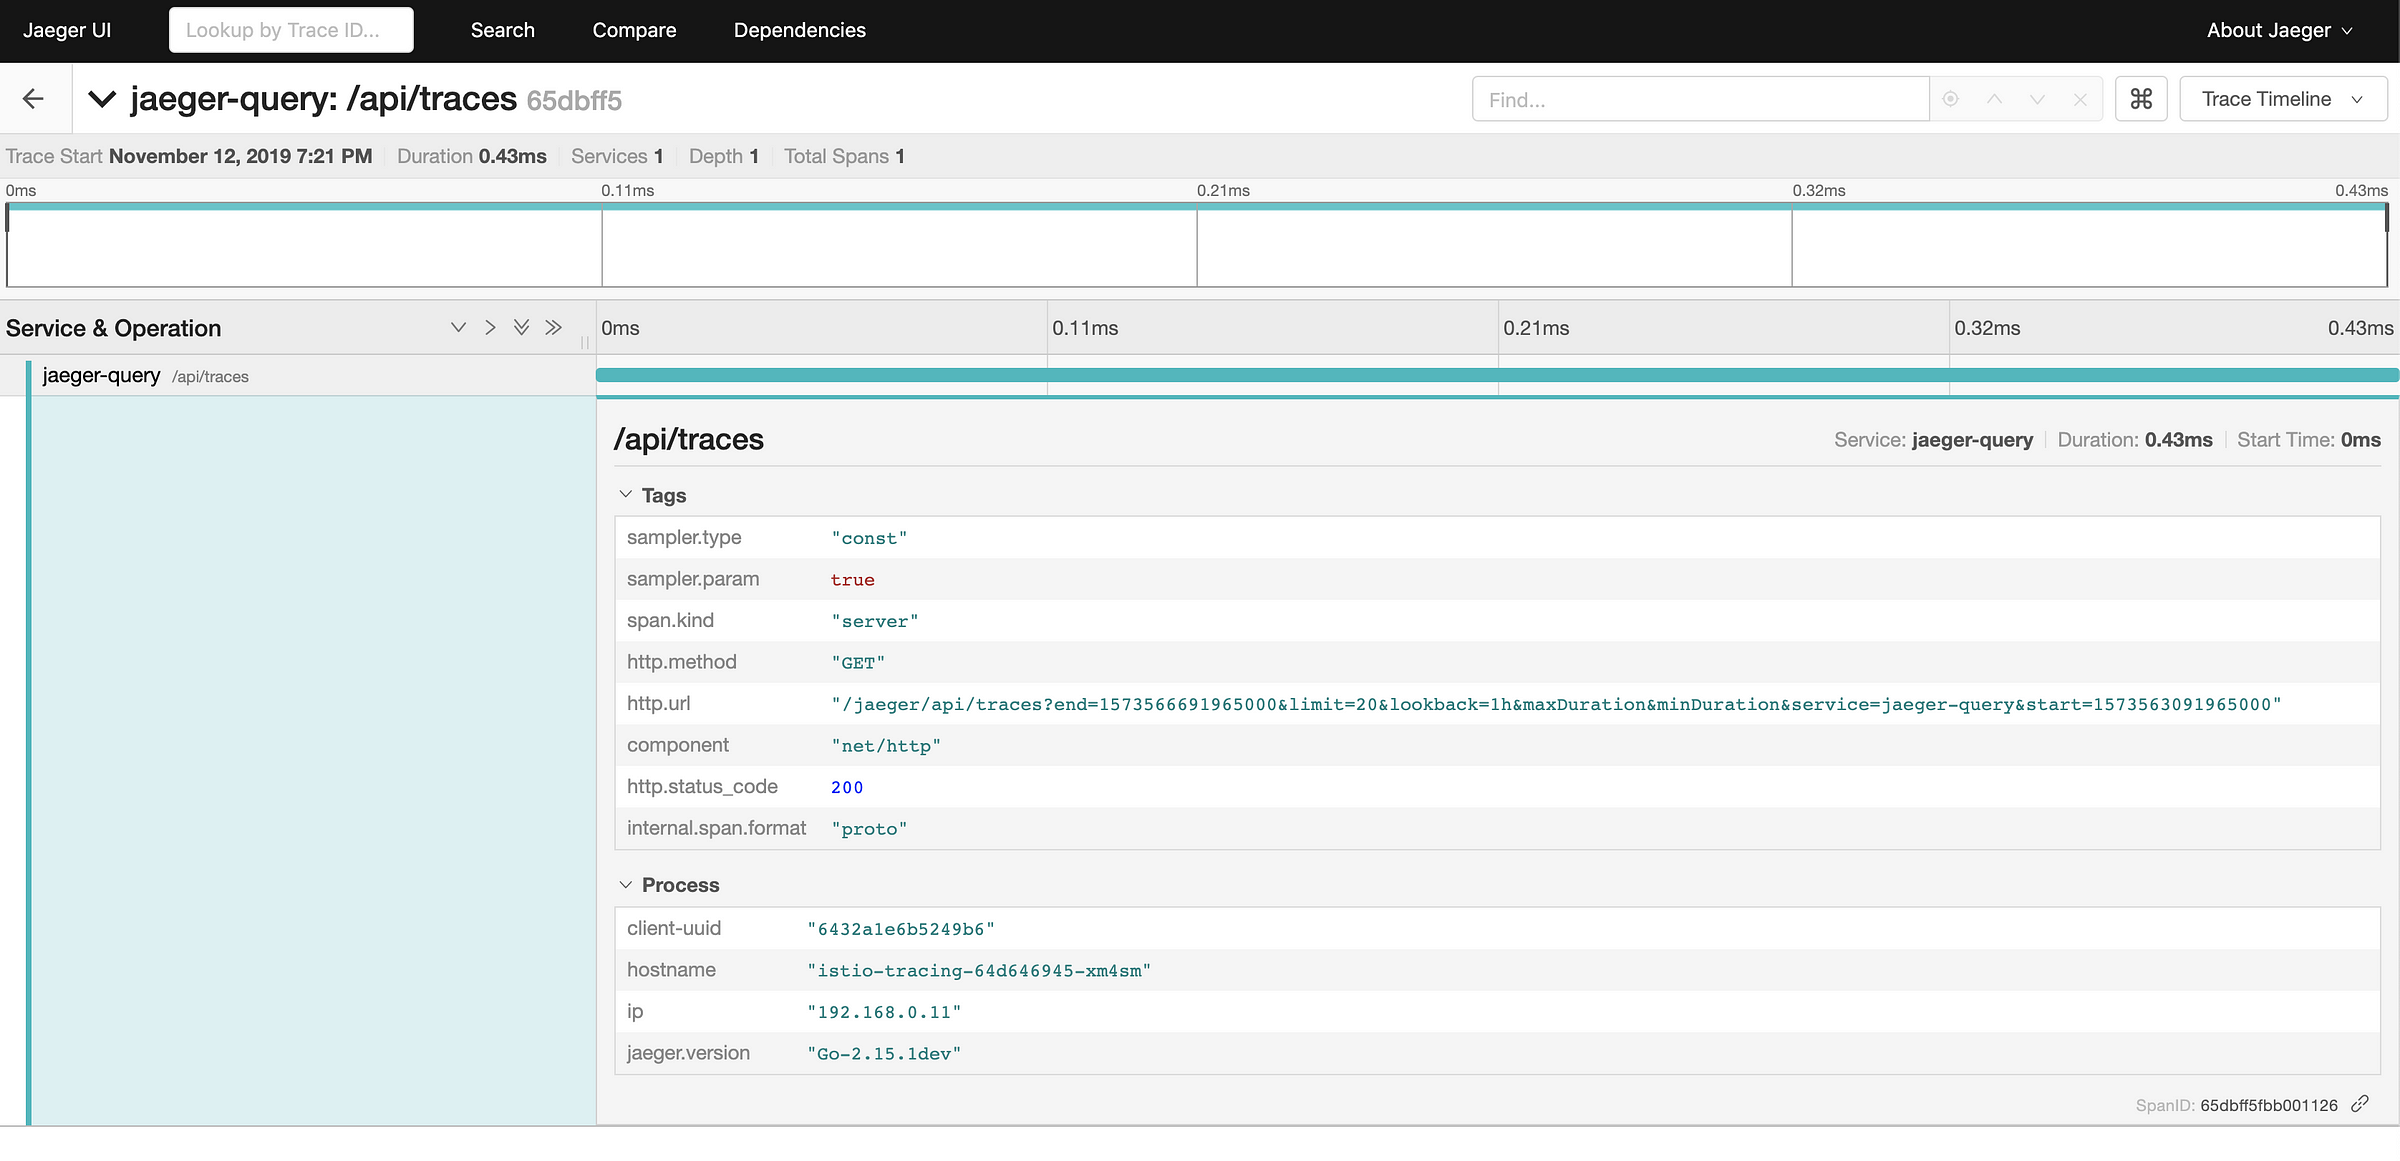
Jaeger-query
Summary:
In this post, we discussed how to install Istio and visualize the
Service-mesh using Kiali from Rancher 2.3.x version, installed on Civo
cloud. We also deployed a sample application, generated some traffic and
visualized it using kiali and Jaeger.
More Resources
For more training on advanced setup and configurtion of your Kubernetes applications, register for Rancher’s Kubernetes Master Classes.
Related Articles
Jan 25th, 2023
Deploy s3gw in Digital Ocean
Oct 27th, 2022
Kubewarden 1.3 is Here
Apr 18th, 2023